Interplay of spermatogonial subpopulations during initial stages of spermatogenesis in adult primates
Capponi C, Palazzoli M, Di Persio S, Fera S, Spadetta G, Franco G, Wistuba J, Schlatt S, Neuhaus N, de Rooij D, Vicini E., 24.05.2023
Abstract
The spermatogonial compartment maintains spermatogenesis throughout the reproductive lifespan. Single-cell RNA sequencing (scRNA-seq) has revealed the presence of several spermatogonial clusters characterized by specific molecular signatures. However, it is unknown whether the presence of such clusters can be confirmed in terms of protein expression and whether protein expression in the subsets overlaps. To investigate this, we analyzed the expression profile of spermatogonial markers during the seminiferous epithelial cycle in cynomolgus monkeys and compared the results with human data. We found that in cynomolgus monkeys, as in humans, undifferentiated spermatogonia are largely quiescent, and the few engaged in the cell cycle were immunoreactive to GFRA1 antibodies. Moreover, we showed that PIWIL4+ spermatogonia, considered the most primitive undifferentiated spermatogonia in scRNA-seq studies, are quiescent in primates. We also described a novel subset of early differentiating spermatogonia, detectable from stage III to stage VII of the seminiferous epithelial cycle, that were transitioning from undifferentiated to differentiating spermatogonia, suggesting that the first generation of differentiating spermatogonia arises early during the epithelial cycle. Our study makes key advances in the current understanding of male germline premeiotic expansion in primates.
Capponi C, Palazzoli M, Di Persio S, Fera S, Spadetta G, Franco G, Wistuba J, Schlatt S, Neuhaus N, de Rooij D, Vicini E. Interplay of spermatogonial subpopulations during initial stages of spermatogenesis in adult primates. Development. 2023 May 15;150(10):dev201430. doi: 10.1242/dev.201430. Epub 2023 May 24. PMID: 37222410.
Publication: https://doi.org/10.1242/dev.201430
 Disclaimer
The publication Interplay of spermatogonial subpopulations during initial stages of spermatogenesis in adult primates by Capponi C, Palazzoli M, Di Persio S, Fera S, Spadetta G, Franco G, Wistuba J, Schlatt S, Neuhaus N, de Rooij D, Vicini E. is published under an open access license: https://creativecommons.org/licenses/by-nc/4.0/. Permits non-commercial re-use, distribution, and reproduction in any medium, provided the original work is properly cited.
Curation by the MFGA team Relevant data sets presented in the publication have been identified. If possible, annotations (title, general information, conditions, processed tissue types and processed cell types) have been added based on information from the publication. Data tables and images that provide a good overview on the publication's findings on the data set have been extracted from the publication and/or supplement. If not stated otherwise, images are depicted with title and description exactly as in the publication. Tables have been adjusted to the MFGA table format. Conducted adjustments are explained in the detailed view of the tables. However, titles and descriptions have been adopted from the publication.
Data set 1: Classification of the spermatogonial compartments and proliferative activity of undiff-SPG in the cynomolgus monkey testis
Other: Immunostaining
Species
| Species |
|---|
| Cynomolgus Macaque |
Tissue Types
| BRENDA tissue ontology | Maturity | Description | Species | Replicates |
|---|---|---|---|---|
| BTO_0001363: testis | A typically paired male reproductive gland that produces sperm and that in most mammals is contained within the scrotum at sexual maturity. | Cynomolgus Macaque |
Cell Types
| Cell ontology | Maturity | Description | Species | Replicates | Cells per replicate |
|---|---|---|---|---|---|
| CL_0000020: spermatogonium | An euploid male germ cell of an early stage of spermatogenesis. | Cynomolgus Macaque |
Images
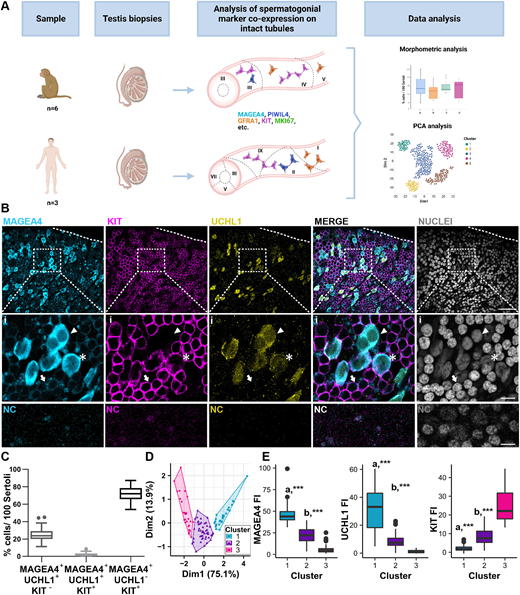
Figure 1: Classification of the spermatogonial compartments in cynomolgus monkey based on marker combinations
(A) Experimental outline. Monkey and human testis biopsies were processed as detailed in the Materials and Methods section. Isolated seminiferous tubules were immunostained for various spermatogonia (SPG) markers and analyzed by confocal microscopy. Immunostainings were quantified followed by morphometric and PCA analyses. Roman numerals represent different stages of seminiferous epithelial cycle. (B) Representative staining of MAGEA4 (cyan)/UCHL1 (yellow)/KIT (magenta)/nuclear staining (grey) on whole-mounted intact seminiferous tubules of cynomolgus monkeys. Insets (i) shows examples of the different SPG: the arrowhead indicates MAGEA4+/UCHL1+/KIT− SPG, the asterisk indicates MAGEA4+/UCHL1+/KIT+ SPG and the arrow indicates MAGEA4+/UCHL1−/KIT+ SPG. Negative controls (NC) show no staining. Scale bars: 50 μm. (C) Box plot shows the percentage of MAGEA4+/UCHL1+/KIT−, MAGEA4+/UCHL1+/KIT+ and MAGEA4+/UCHL1−/KIT+ SPG. More than 4900 cells were counted from three animals. (D) Cluster analysis performed on a total of 97 cells from three animals. Each dot represents a cell, and the three colours represent the resulting clusters: cluster 1 (blue), cluster 2 (purple), cluster 3 (magenta). (E) Box plots representing MAGEA4, UCHL1 and KIT fluorescence intensity (FI) in the three clusters. a***, P<0.001 cluster 1 versus clusters 2 and 3; b***, P<0.001 cluster 2 versus cluster 3. Details regarding the statistical analysis are provided in Table S3. Box plots elements are defined as follows: center line: median; box limits: upper and lower quartiles; whiskers: 1.5× interquartile range; points: outliers.
Licensed under: https://creativecommons.org/licenses/by-nc/4.0/

Figure 2: Undifferentiated spermatogonial subsets are detected along all the stages of the epithelial cycle
(A,D,G) Representative images of PIWIL4 (blue)/UTF1 (green)/nuclei (grey) (A), PIWIL4 (blue)/GFRA1 (orange)/nuclei (grey) (D) and UTF1 (green)/GFRA1 (orange)/nuclei (grey) (G) stainings. Insets show examples of positive and negative SPG. NC show no staining. Scale bars: 20 µm (main); 10 µm (insets). (B,C) Quantification of the percentage of UTF1+/PIWIL4+ and UTF1+/PIWIL4− SPG and their distribution in each stage of seminiferous epithelial cycle. Total cells counted: 2700 from three animals. (E,F) Percentage of PIWIL4+/GFRA1−, PIWIL4+/GFRA1+ and PIWIL4−/GFRA1+ SPG and their distribution in each stage of seminiferous epithelial cycle. Total cells counted: 2000 from three animals. (H,I) Percentage of UTF1+/GFRA1− and UTF1+/GFRA1+ SPG and their distribution in each stage of seminiferous epithelial cycle. Total cells counted: 2410 from three animals. Box plots in B, E and H are defined as follows: center line: median; box limits: upper and lower quartiles; whiskers: 1.5× interquartile range. In C, F and I, data are mean±s.e.m.
Licensed under: https://creativecommons.org/licenses/by-nc/4.0/
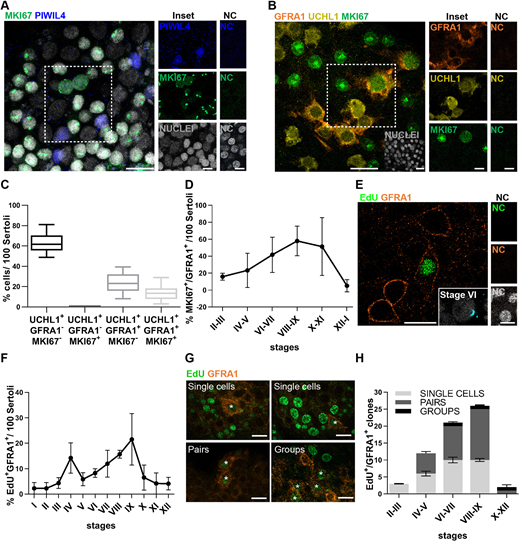
Figure 3: The proliferative activity among undiff-SPG is entirely sustained by GFRA1-expressing SPG
(A) Representative image of MKI67 (green)/PIWIL4 (blue)/nuclei (grey) staining in cynomolgus monkey seminiferous tubules. Insets show examples of MKI67+/PIWIL4− and MKI67−/PIWIL4+ SPG. NC show no staining. (B) Representative image of UCHL1 (yellow)/GFRA1 (orange)/MKI67 (green) staining. Insets show examples of positive and negative SPG. NC show no staining. (C) Box plot representing the percentage of UCHL1/GFRA1/MKI67 cell population. Data are from 600 cells scored in three animals. Box plot elements are defined as follows: center line: median; box limits: upper and lower quartiles; whiskers: 1.5× interquartile range. (D) Distribution of the percentage of MKI67+/GFRA1+ SPG along the stages of the seminiferous epithelial cycle. Data are from 1000 cells scored in three animals. (E) Representative image of EdU (green)/GFRA1 (orange) staining in a cynomolgus monkey. Inset shows ACR (cyan) staging relative to the main figure. NC show no staining. (F) Distribution of EdU+/GFRA1+ SPG during the cycle of the seminiferous epithelium. A total of 150 EdU+/GFRA1+ SPG were counted in four animals. (G,H) Representative images of EdU+ single cells, pairs and a four-cell group (G) and clonal size evaluation of EdU+/GFRA1+ SPG during the cycle of the seminiferous epithelium (H). A total of 61 clones were detected in four animals. In D, F and H, data are mean±s.e.m. Scale bars: 20 µm (main A,B,E,G); 10 µm (insets A,B,E).
Licensed under: https://creativecommons.org/licenses/by-nc/4.0/
Data set 2: Kinetics of the diff-SPG in cynomolgus monkey
Other: Immunostaining
Species
| Species |
|---|
| Cynomolgus Macaque |
Tissue Types
| BRENDA tissue ontology | Maturity | Description | Species | Replicates |
|---|---|---|---|---|
| BTO_0001363: testis | A typically paired male reproductive gland that produces sperm and that in most mammals is contained within the scrotum at sexual maturity. | Cynomolgus Macaque |
Cell Types
| Cell ontology | Maturity | Description | Species | Replicates | Cells per replicate |
|---|---|---|---|---|---|
| CL_0000020: spermatogonium | An euploid male germ cell of an early stage of spermatogenesis. | Cynomolgus Macaque |
Images
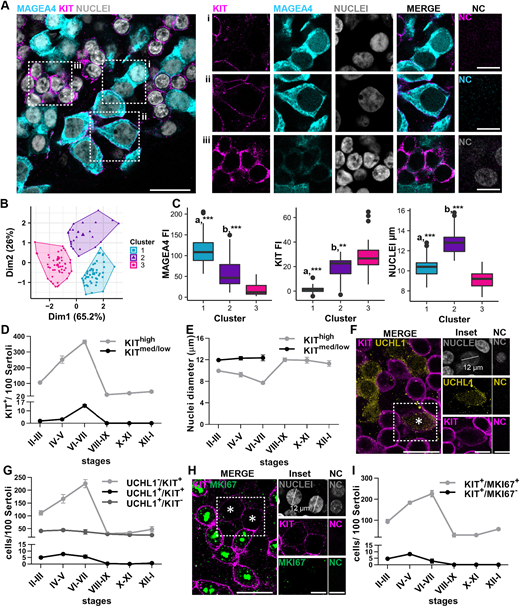
Figure 4: Early differentiating SPG are detected at stage III of the cycle
(A) Representative image of MAGEA4 (cyan)/KIT (magenta)/nuclei (grey) staining performed on whole-mount intact tubules. Insets show examples of positive and negative SPG: (i) example of MAGEA4+/KIT− SPG; (ii) example of MAGEA4+/KITmed/low SPG; and (iii) example of MAGEA4+/KIThigh SPG. NC show no staining. (B) Cluster analysis performed on 126 cells from three animals. Each dot represents a cell, and the three colours represent the resulting clusters: cluster 1 (blue), cluster 2 (purple), cluster 3 (magenta). (C) Box plot representing MAGEA4/KIT fluorescence intensity (FI) and nuclear size in the three clusters. MAGEA4 FI: a*** P<0.001 cluster 1 versus clusters 2 and 3; b*** P<0.001 cluster 2 versus cluster 3. KIT FI: a*** P<0.001 cluster 1 versus clusters 2 and 3; b** P<0.01 cluster 2 versus cluster 3. NUCLEI: a*** P<0.001 cluster 1 versus clusters 2 and 3; b*** P<0.001 cluster 2 versus cluster 3. Details regarding the statistical analysis are provided in Table S3. Box plot elements are defined as follows: center line: median; box limits: upper and lower quartiles; whiskers: 1.5× interquartile range; points: outliers. (D) Distribution of the number of KIT+ SPG in each stage of the cycle of the seminiferous epithelium. Data are from 6000 cells scored from three different animals. (E) Nuclear diameters of KIT+ SPG in each stage of the cycle of the seminiferous epithelium. n=3 animals. (F) Representative picture of UCHL1+ (yellow)/KIT+ (magenta) SPG (white asterisk). Nuclear staining shown in grey. Insets show an example of UCHL1+/KIT+ SPG. Dashed line indicates the nuclear diameter of selected SPG. NC show no staining. (G) Line plot representing the distribution of the UCHL1+/KIT−, UCHL1+/KIT+ and UCHL1−/KIT+ cells during the stages of the cycle of the seminiferous epithelium. 7200 cells were counted from three animals. (H) Representative image of the MKI67 (green)/KIT (magenta) staining. Nuclear staining shown in grey. White asterisks indicate MKI67−/KITmed/low SPG. Insets show example of MKI67−/KITmed/low SPG. Dashed line indicates the nuclear diameter of selected SPG. NC show no staining. (I) Distribution of KIT+/MKI67+and KIT+/MKI67− SPG during the stages of the epithelial cycle. A total of 6000 cells were counted from three animals. In D, E, G and I, data are mean±s.e.m. Scale bars: 20 µm (main); 10 µm (insets).
Licensed under: https://creativecommons.org/licenses/by-nc/4.0/
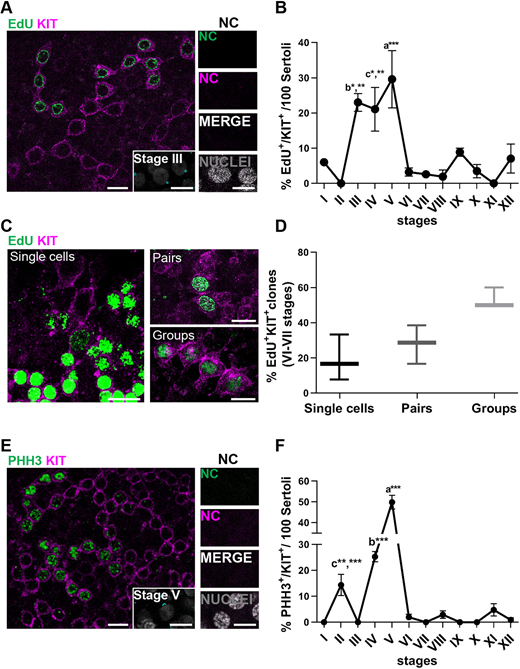
Figure 5: Kinetics of the diff-SPG in cynomolgus monkey
(A) Representative images of EdU+ (green)/KIT+ (magenta) SPG. Nuclear staining shown in grey. Inset shows ACR (cyan) staging relative to the main figure. NC show no staining. (B) Line plot showing the percentage of EdU+/KIT+ SPG during the cycle of the seminiferous epithelium. A total of 1500 EdU+/KIT+ SPG were scored in three animals. b* P<0.05 stage III versus stages I, VIII and XII; b** P<0.01 stage III versus stages II, VI, VII,IX, X and XI; c* P<0.05 stage IV versus stages I, VI, VII, VIII, IX and X; c** P<0.01 stage IV versus stages II, XI and XII; a*** P<0.001 stage V versus stages I, II, VI, VII, VIII, IX, X, XI and XII (ANOVA). (C) Representative images of EdU+/KIT+ SPG clones in stages VI-VII. EdU+/KIT+ SPG in S-phase are arranged as single cells, pairs and four-cell clones. (D) Box plot representing the clonal size of EdU+/KIT+ SPG at stage VI-VII of the seminiferous cycle. A total of 37 clones were scored from three animals. Bot plot elements are defined as follows: center line: median; box limits: upper and lower quartiles; whiskers: 1.5× interquartile range. (E) Representative image of PHH3 (green)/KIT (magenta) staining. Inset shows ACR (cyan) staging relative to the main figure. NC show no staining. (F) Distribution of PHH3+/KIT+ cells per stage. A total of 1700 KIT+ SPG were scored in three animals. c** P<0.01 stage II versus stage XI; c*** P<0.001 stage II versus stages III, VI, VII, VIII, IX, X and XII; b*** P<0.001 stage IV versus stages I, II, III, VI, VII, VIII, IX, X, XI and XII; a*** P<0.001 stage V versus stages I, II, III, IV, VI, VII, VIII, IX, X, XI and XII (ANOVA). In B and F, data are mean±s.e.m. Scale bars: 20 µm (main A,C,E); 10 µm (insets A,E).
Licensed under: https://creativecommons.org/licenses/by-nc/4.0/
Data set 3: Comparative analysis in human spermatogonial compartment
Other: Immunostaining
Species
| Species |
|---|
| Human |
Tissue Types
| BRENDA tissue ontology | Maturity | Description | Species | Replicates |
|---|---|---|---|---|
| BTO_0001363: testis | A typically paired male reproductive gland that produces sperm and that in most mammals is contained within the scrotum at sexual maturity. | Human |
Cell Types
| Cell ontology | Maturity | Description | Species | Replicates | Cells per replicate |
|---|---|---|---|---|---|
| CL_0000020: spermatogonium | An euploid male germ cell of an early stage of spermatogenesis. | Human |
Images
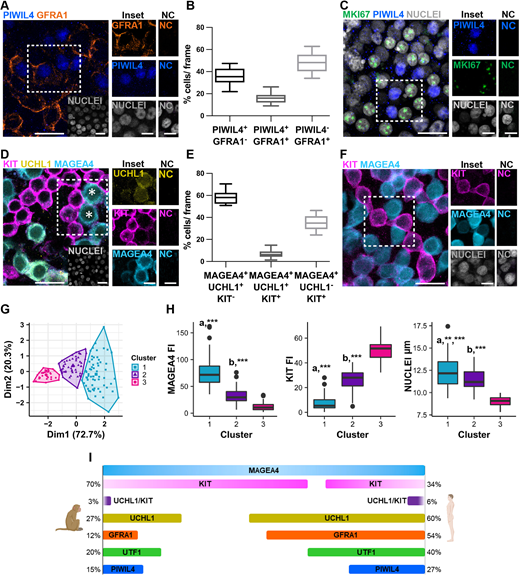
Figure 6: Comparative analysis shows conserved features of the spermatogonial compartment in human and nonhuman primates
(A) Representative image of PIWIL4 (blue)/GFRA1 (orange)/nuclei (grey) staining in human seminiferous tubules. Insets show examples of PIWIL4+/GFRA1+ and PIWIL4+/GFRA1− SPG. NC show no staining. (B) Box plot representing the percentage of PIWIL4+/GFRA1−, PIWIL4+/GFRA1+ and PIWIL4−/GFRA1+ SPG in human seminiferous tubules. A total of 3104 cells were counted from three patients. (C) Representative image of MKI67 (green)/PIWIL4 (blue)/nuclei (grey) staining in human seminiferous tubules. Insets show examples of MKI67+/PIWIL4− and MKI67−/PIWIL4+ SPG. NC show no staining. (D) Representative image of MAGEA4 (cyan)/UCHL1 (yellow)/KIT (magenta)/nuclear staining (grey) on human seminiferous tubules. Insets show examples of MAGEA4+/UCHL1+/KIT+-positive SPG (asterisks). NC show no staining. (E) Box plot showing the percentage of MAGEA4+/UCHL1+/KIT−, MAGEA4+/UCHL1+/KIT+ and MAGEA4+/UCHL1−/KIT+ SPG measured using human seminiferous tubules. More than 5117 cells were counted from three patients. (F) Representative image of MAGEA4 (cyan)/KIT (magenta)/nuclei (grey) staining in human seminiferous tubules. Insets show examples of MAGEA4+/KIT− and MAGEA4+/KIT+ cells. NC show no staining. (G) Cluster analysis performed on a total of 151 cells from three donors. Each dot represents a cell, and the three colours represent the resulting clusters: cluster 1 (blue), cluster 2 (purple), cluster 3 (magenta). (H) Box plots representing MAGEA4/KIT fluorescence intensity (FI) and nuclear size in the three clusters. MAGEA4: a*** P<0.001 cluster 1 versus clusters 2 and 3; b*** P<0.001 cluster 2 versus cluster 3; KIT: a*** P<0.001 cluster 1 versus clusters 2 and 3; b*** P<0.001 cluster 2 versus cluster 3. NUCLEI: a** P<0.01 cluster 1 versus cluster 2, a*** P<0.001 cluster 1 versus cluster 3; b*** P<0.001 cluster 2 versus cluster 3. Details regarding the statistical analysis are provided in Table S3. (I) Schematic comparing the proportions of SPG subsets between cynomolgus monkey and human. Each percentage is related to 100% of MAGEA4+ SPG. Box plot elements are defined as follows: center line: median; box limits: upper and lower quartiles; whiskers: 1.5× interquartile range; points: outliers. Scale bars: 20 µm (main); 10 µm (insets).
Licensed under: https://creativecommons.org/licenses/by-nc/4.0/