A new paradigm for profiling testicular gene expression during normal and disturbed human spermatogenesis
C. Feig, C. Kirchhoff, R. Ivell, O. Naether, W. Schulze, A.-N. Spiess, 17.11.2006
Abstract
The aim of this study was to identify gene expression patterns of the testis that correlate with the appearance of distinct stages of male germ cells. We avoided the pitfalls of mixed pathological phenotypes of the testis and circumvented the inapplicability of using the first spermatogenic wave as done previously on rodents. This was accomplished by using 28 samples showing defined and highly homogeneous pathologies selected from 578 testicular biopsies obtained from 289 men with azoospermia (two biopsies each). The molecular signature of the different developmental stages correlated with the morphological preclassification of the testicular biopsies, as shown by resampling-based hierarchical clustering using different measures of variability. By using analysis of variance (ANOVA) and extensive permutation analysis, we filtered 1181 genes that exhibit exceptional statistical significance in testicular expression and grouped subsets with transcriptional changes within the pre-meiotic (348 genes), post-meiotic (81 genes) and terminal differentiation (38 genes) phase. Several distinct molecular classes, metabolic pathways and transcription factor binding sites are involved, depending on the transcriptional profile of the gene clusters that were built using a novel clustering procedure based on not only similarity but also statistical significance.
FEIG, C., et al. A new paradigm for profiling testicular gene expression during normal and disturbed human spermatogenesis. Molecular human reproduction, 2007, 13. Jg., Nr. 1, S. 33-43.
Publication: https://doi.org/10.1093/molehr/gal097
 Disclaimer
The publication A new paradigm for profiling testicular gene expression during normal and disturbed human spermatogenesis by C. Feig, C. Kirchhoff, R. Ivell, O. Naether, W. Schulze, A.-N. Spiess is published under an open access license: https://creativecommons.org/licenses/by-nc/4.0. Original artical was published in Molecular Human Reproduction by Oxford University Press. Rights granted: Share — copy and redistribute the material in any medium or format Adapt — remix, transform, and build upon the material
Curation by the MFGA team Relevant data sets presented in the publication have been identified. If possible, annotations (title, general information, conditions, processed tissue types and processed cell types) have been added based on information from the publication. Data tables and images that provide a good overview on the publication's findings on the data set have been extracted from the publication and/or supplement. If not stated otherwise, images are depicted with title and description exactly as in the publication. Tables have been adjusted to the MFGA table format. Conducted adjustments are explained in the detailed view of the tables. However, titles and descriptions have been adopted from the publication.
Data set 1: Study 1
Exome: Microarray
Species
| Species |
|---|
| human |
Conditions
| Human phenotype ontology | Participants | Comment |
|---|---|---|
| HP:0011961: Non-obstructive azoospermia | 289 |
Tissue Types
| BRENDA tissue ontology | Maturity | Description | Species | Replicates |
|---|---|---|---|---|
| BTO_0006172: testicular somatic cell | Adult | 28 samples showing defined and highly homogeneous pathologies selected from 578 testicular biopsies obtained from 289 men. | human | 289 |
Images
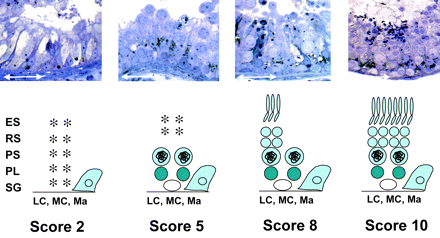
Figure 1: Morphological classification used for preselection of testicular samples
Upper panel: Semi-thin section micrographs of representative testis samples that underwent modified Johnsen scoring and were subsequently used for microarray analysis. Lower panel: Diagrammatic and non-quantitative representation of cell types found in testicular biopsies as classified by the morphological criteria. Score 2: Sertoli-cell-only syndrome (SCOS); Score 5: meiotic arrest; Score 8: hypospermatogenesis; Score 10: full spermatogenesis. ES, elongated spermatids/testicular spermatozoa; LC, Leydig cells; Ma, macrophages; MC, myoid cells; PL, preleptotene spermatocytes; PS, pachytene spermatocytes; SG, spermatogonia; RS, round spermatids. White arrows indicate 50 μm scale.
Licensed under: https://creativecommons.org/licenses/by-nc/4.0
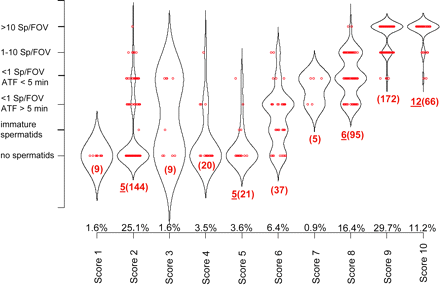
Figure 2: Representativity of selected biopsies.
Kernel density box-plot from 578 testicular biopsies obtained from 289 individuals correlating the histologicalscore from one biopsy with number and search time of testicular spermatozoa found in an independent second biopsy used for testicular sperm extraction (TESE)from the same testis. The area of the kernel density curves correlate with the proportion of samples within the category. Red dots depict the biopsy samples, rednumbers are the number versus total number (in brackets) of samples used for the microarray analysis within the category, numbers (in %) on the x-axis representthe percentage of scored samples in relation to the complete clinical population. ATF, average time to find; Sp/FOV, testicular spermatozoa per microscopic field-of-view. Both criteria (FOV, ATF) are parameters derived from microscopical detection of spermatozoa during the TESE process.
Licensed under: https://creativecommons.org/licenses/by-nc/4.0
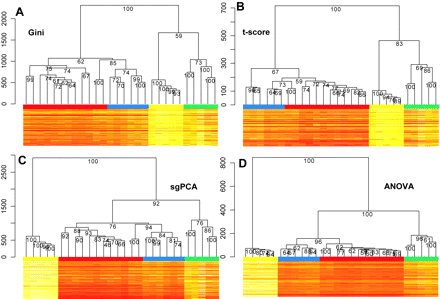
Figure 3: Hierarchical clustering (average linkage and manhattan metric) of gene expression profiles from human testicular biopsies
(A) Gini index (top 200genes).</br>(B) t-score (top 1000 genes).</br>(C) Single-gene principle component analysis (sgPCA) (top 200 genes).</br>(D) Clustering of the gene expression profile obtainedby defining four groups [analysis of variance (ANOVA)] as obtained by morphological scoring (top 200 genes). </br>The heat map representation of the top 200 genesfor each statistic is shown below the dendrograms. Each hierarchical clustering tree was subjected to 2000 permutations with cluster stability as percent stability ofthe tree nodes. Colour bars on top of the heat map represent the histological subgroups (Score 2: yellow; Score 5: green; Score 8: blue; Score 10: red).
Licensed under: https://creativecommons.org/licenses/by-nc/4.0
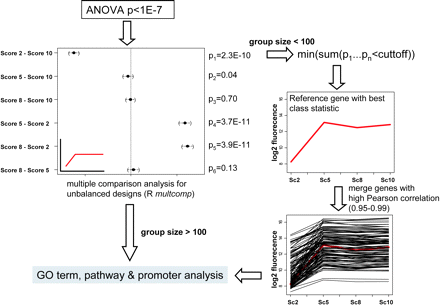
Figure 4: Statistical workflow for clustering of genes with similar expression patterns
Genes with a P value < 1E–7 obtained from analysis of variance (ANOVA)analysis were subjected to multiple pairwise comparison analysis (Tukey–Kramer test) using the R multcomp package for unbalanced designs. If sample sizeswithin the calculated groups were high enough for subsequent gene ontology (GO) term and pathway analysis (>100 genes), then these groups were not furthermodified. If sample sizes were smaller, we filtered a reference gene from within the group by isolating the gene with the minimum sum of P values from all multi-ple comparisons that were below the threshold P value. We then merged those genes to the reference gene that follow the same expression profile by varying thePearson correlation values (0.95–0.99). For each of these values we analysed the resulting groups in respect to over-representation and chose those with a clear ten-dency between the various correlation settings. The inset in the multcomp graphic is the theoretical expression profile deduced from the pairwise comparison results(red line). Note that this profile matches exactly with the isolated reference gene and merged gene group.
Licensed under: https://creativecommons.org/licenses/by-nc/4.0
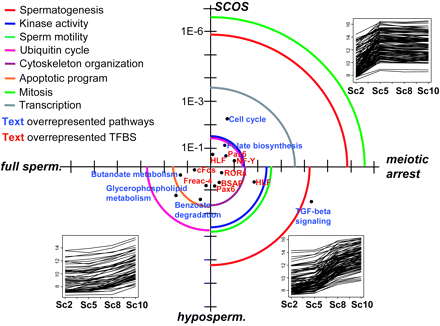
Figure 5: Circular diagram summarizing differences in protein function, pathways and promoters between the various testicular subtypes
Clustered gene groupswere subjected to extensive analysis in respect to gene ontology (GO) terms (biological process), over-represented pathways and over-represented transcription fac-tor binding sites (TFBS) to discriminate the functional differences. Over-representation and axis scales are shown as P values. Circular lines represent gene ontol-ogy (GO) terms, blue and red text symbols in the graph are over-represented pathways and transcription factor binding sites, respectively.
Licensed under: https://creativecommons.org/licenses/by-nc/4.0
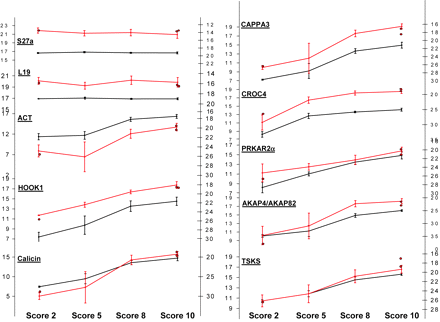
Figure 6: Validation of microarray data by quantitative real-time PCR (qRT-PCR)
Two housekeeping genes (S27a and L19) and eight differentially transcribedgenes (ACT, HOOK1, Calicin, TSKS, CAPPA3, CROC4, PRKAR2a and AKAP4/AKAP82) were validated by qRT-PCR on the same 28 samples as used for themicroarray experiments. Furthermore, three samples (two score 10 and one score 2) from an independent set of individuals were also subjected to qRT-PCR,depicted as red dots on the graph lines. Black line represents expression levels from microarray data corresponding to the left axis with log(2) fluorescence values,and red line represents expression levels from qRT-PCR data corresponding to the right axis with crossing points from the qRT-PCR. Error bars indicate standarddeviation from the replicates of the four groups (n = 12, 6, 5, 5).
Licensed under: https://creativecommons.org/licenses/by-nc/4.0