Development and Disease-Dependent Dynamics of Spermatogonial Subpopulations in Human Testicular Tissues
Joana M. D. Portela, Laura Heckmann, Joachim Wistuba, Andrea Sansone, Ans M. M. van Pelt, Sabine Kliesch, Stefan Schlatt and Nina Neuhaus, 14.01.2020
Abstract
Cancer therapy and conditioning treatments of non-malignant diseases affect spermatogonial function and may lead to male infertility. Data on the molecular properties of spermatogonia and the influence of disease and/or treatment on spermatogonial subpopulations remain limited. Here, we assessed if the density and percentage of spermatogonial subpopulation changes during development (n = 13) and due to disease and/or treatment (n = 18) in tissues stored in fertility preservation programs, using markers for spermatogonia (MAGEA4), undifferentiated spermatogonia (UTF1), proliferation (PCNA), and global DNA methylation (5mC). Throughout normal prepubertal testicular development, only the density of 5mC-positive spermatogonia significantly increased with age. In comparison, patients affected by disease and/or treatment showed a reduced density of UTF1-, PCNA- and 5mC-positive spermatogonia, whereas the percentage of spermatogonial subpopulations remained unchanged. As an exception, sickle cell disease patients treated with hydroxyurea displayed a reduction in both density and percentage of 5mC- positive spermatogonia. Our results demonstrate that, in general, a reduction in spermatogonial density does not alter the percentages of undifferentiated and proliferating spermatogonia, nor the establishment of global methylation. However, in sickle cell disease patients’, establishment of spermatogonial DNA methylation is impaired, which may be of importance for the potential use of this tissues in fertility preservation programs.
PORTELA, Joana, et al. Development and disease-dependent dynamics of spermatogonial subpopulations in human testicular tissues. Journal of clinical medicine, 2020, 9. Jg., Nr. 1, S. 224.
Publication: https://doi.org/10.3390/jcm9010224
 Disclaimer
The publication Development and Disease-Dependent Dynamics of Spermatogonial Subpopulations in Human Testicular Tissues by Joana M. D. Portela, Laura Heckmann, Joachim Wistuba, Andrea Sansone, Ans M. M. van Pelt, Sabine Kliesch, Stefan Schlatt and Nina Neuhaus is published under an open access license: https://creativecommons.org/licenses/by/4.0/. Creative Commons Attribution License which permits unrestricted use, distribution, and reproduction in any medium, provided the original work is properly cited
Curation by the MFGA team Relevant data sets presented in the publication have been identified. If possible, annotations (title, general information, conditions, processed tissue types and processed cell types) have been added based on information from the publication. Data tables and images that provide a good overview on the publication's findings on the data set have been extracted from the publication and/or supplement. If not stated otherwise, images are depicted with title and description exactly as in the publication. Tables have been adjusted to the MFGA table format. Conducted adjustments are explained in the detailed view of the tables. However, titles and descriptions have been adopted from the publication.
Data set 1: Density of Spermatogonial Subpopulations during Testicular Development
Proteome: Immunohistochemistry
Species
| Species |
|---|
| Human |
Conditions
| Human phenotype ontology | Participants | Comment |
|---|---|---|
| HP:control | 7 | Adult testicular tissue was obtained from patients who underwent orchiectomy as part of prostate cancer treatment. Adult controls (n = 7; 62–79 years) |
| HP:other: Other | 36 | The patient cohort comprised patients diagnosed inter alia with cancer, non-malignant hematological disorders including sickle cell disease and thalassemia, and cryptorchidism. |
Tissue Types
| BRENDA tissue ontology | Maturity | Description | Species | Replicates |
|---|---|---|---|---|
| BTO_0001363: testis | Immature testicular tissue was collected from 36 patients included in fertility preservation programs. Patients were further divided into two subgroups: NT group included untreated cancer patients without any preexisting (congenital) risk factors for impaired testicular function; AT group comprised patients with testicular tissue potentially affected by pathologies known to affect the testicular function. | Human |
Cell Types
| Cell ontology | Maturity | Description | Species | Replicates | Cells per replicate |
|---|---|---|---|---|---|
| CL_0000020: spermatogonium |
Images
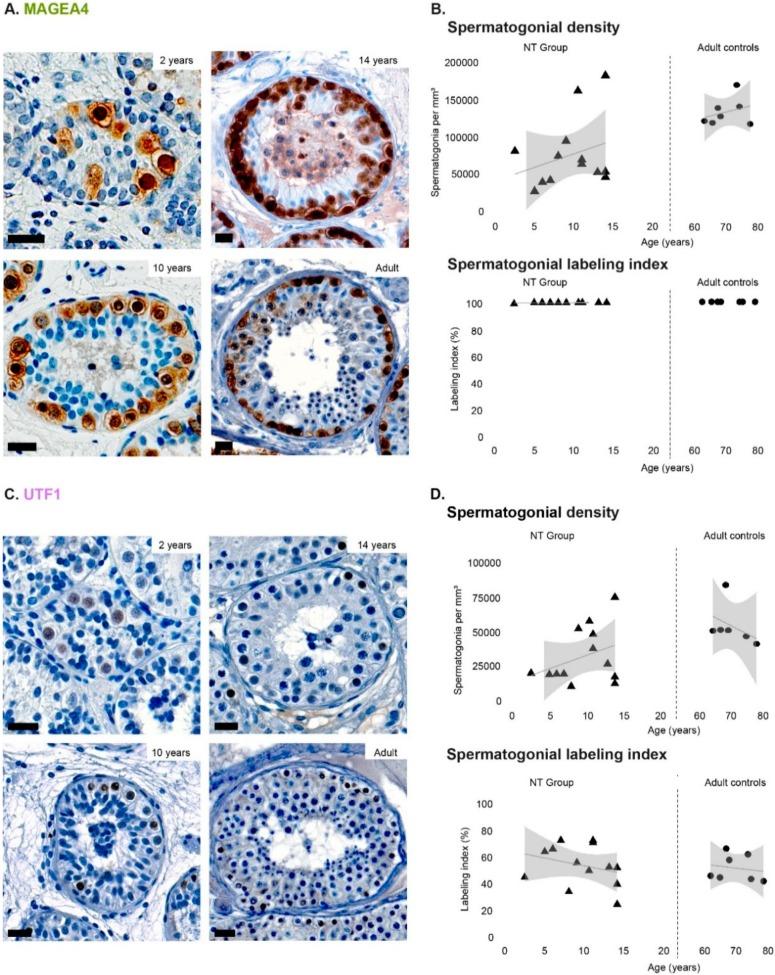
Figure 1. Spermatogonial expression of MAGEA4 and UTF1 throughout age.
(A) Immunohistochemical identification of MAGEA4-positive (brown) spermatogonia at several testicular developmental stages. Scale bar: 20 µm. (B) Density and labeling index (%) of MAGEA4-positive spermatogonia during normal development (NT group) and adulthood. (C) Immunohistochemical identification of UTF1-positive (brown) spermatogonia at several testicular developmental stages. Scale bar: 20 µm. (D) Density and labeling index (%) of UTF1-positive spermatogonia during normal development (NT group) and adulthood. Individual values, trend line, and 95% confidence interval are represented. Generalized linear models were used to predict the response of labeling index based on the patients’ age.
Licensed under: https://creativecommons.org/licenses/by/4.0/
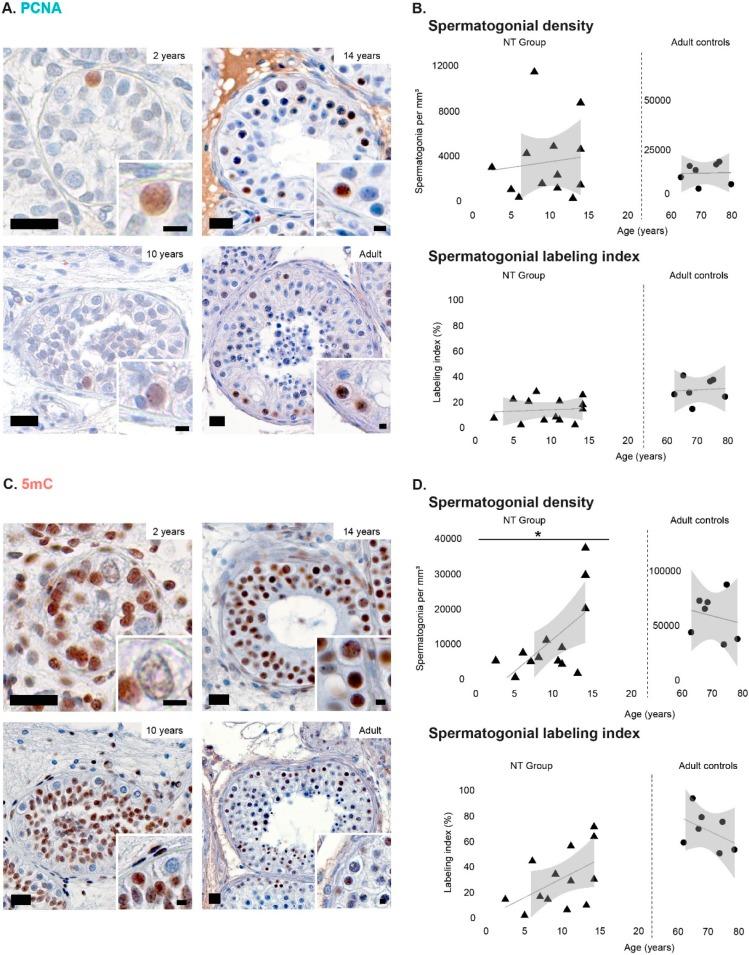
Figure 2. Spermatogonial expression of PCNA and 5mC throughout age.
(A) Immunohistochemical identification of PCNA-positive (brown) spermatogonia at several testicular developmental stages. Scale bar: 20 µm. (B) Density and labeling index (%) of PCNA-positive spermatogonia during normal development (NT group) and adulthood. (C) Immunohistochemical identification of 5mC-positive (brown) spermatogonia at several testicular developmental stages. Scale bar: 20 µm. (D) Density and labeling index (%) of 5mC-positive spermatogonia during normal development (NT group) and adulthood. Individual values, trend line, and 95% confidence interval are represented. Generalized linear models were used to predict the response of labeling index based on the patients’ age. Statistically significant difference is represented as * p < 0.05.
Licensed under: https://creativecommons.org/licenses/by/4.0/
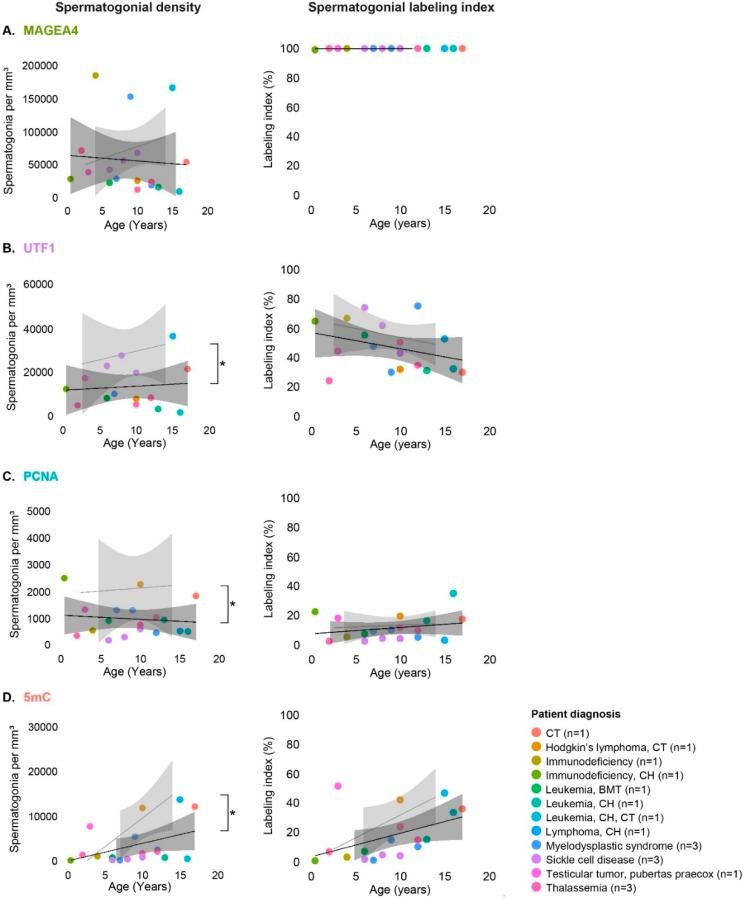
Figure 4. Spermatogonial density and labeling indices (%) of patients with potentially affected tissue by disease and/or treatment (AT group) compared with established values during normal testicular development (NT group).
Spermatogonial density and labeling indices (%) of patients with potentially affected tissue by disease and/or treatment (AT group) compared with established values during normal testicular development (NT group). (A) MAGEA4, (B) UTF1, (C) PCNA, and (D) 5mC labeling index. Results for each AT patient are represented with individual dots colored according to diagnosis. Previously established reference values throughout age (NT group) are represented as light-gray area (95% confidence interval). Wilcoxon rank-sum test was used to compare labeling indices of the AT group with the reference during testicular development. Statistically significant difference is represented as * p < 0.05. Abbreviations: CT—cryptorchid testes; CH—chemotherapy; BMT—bone marrow transplantation.
Licensed under: https://creativecommons.org/licenses/by/4.0/
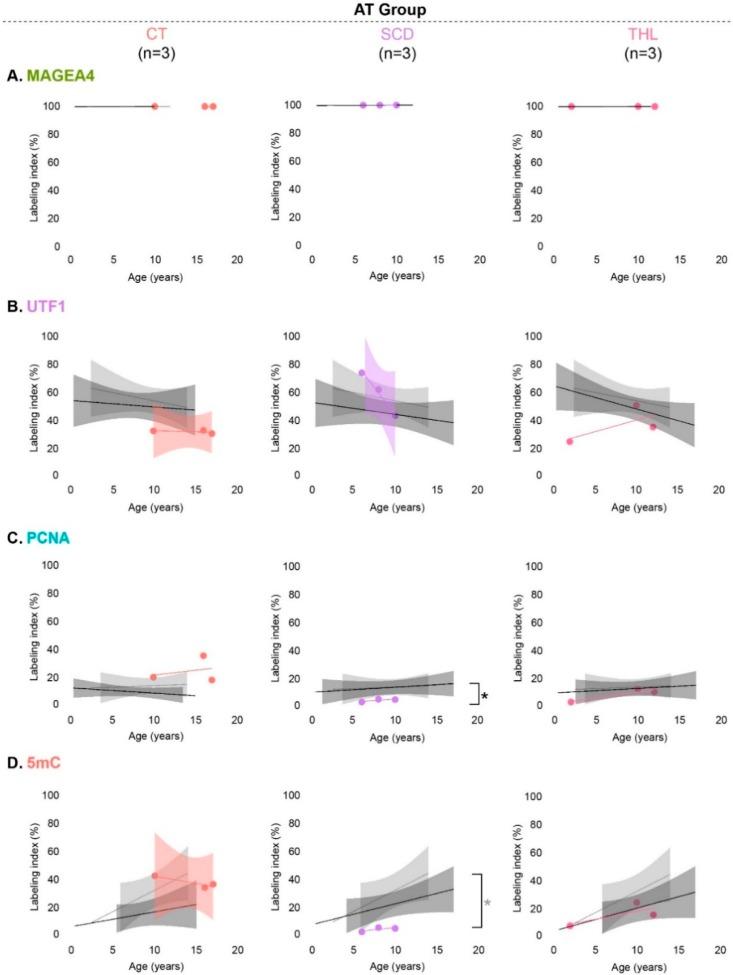
Figure 5. Spermatogonial labeling indices (%) of patients with potentially affected tissues (AT group) particularly due to cryptorchidism (CT), sickle cell disease (SCD), and thalassemia (THL) in comparison with established reference values (NT group) and patients within the AT group without the respective pathology.
Spermatogonial labeling indices (%) of patients with potentially affected tissues (AT group) particularly due to cryptorchidism (CT), sickle cell disease (SCD), and thalassemia (THL) in comparison with established reference values (NT group) and patients within the AT group without the respective pathology. (A) MAGEA4, (B) UTF1, (C) PCNA, and (D) 5mC labeling index. Previously established values throughout development (95% confidence interval) are represented as light-gray area for the NT group and as dark-gray area for patients within the AT group without the respective pathology. Wilcoxon rank-sum test was used to compare labeling indices between groups. Statistically significant differences (* p < 0.016) resulting from comparisons with the NT group are represented in light-gray and with patients within the AT group without the respective pathology in black.
Licensed under: https://creativecommons.org/licenses/by/4.0/