Transcriptome analyses in infertile men reveal germ cell-specific expression and splicing patterns
Siebert-Kuss LM, Krenz H, Tekath T, Wöste M, Di Persio S, Terwort N, Wyrwoll MJ, Cremers JF, Wistuba J, Dugas M, Kliesch S, Schlatt S, Tüttelmann F, Gromoll J, Neuhaus N, Laurentino S, 29.11.2022
Abstract
The process of spermatogenesis-when germ cells differentiate into sperm-is tightly regulated, and misregulation in gene expression is likely to be involved in the physiopathology of male infertility. The testis is one of the most transcriptionally rich tissues; nevertheless, the specific gene expression changes occurring during spermatogenesis are not fully understood. To better understand gene expression during spermatogenesis, we generated germ cell-specific whole transcriptome profiles by systematically comparing testicular transcriptomes from tissues in which spermatogenesis is arrested at successive steps of germ cell differentiation. In these comparisons, we found thousands of differentially expressed genes between successive germ cell types of infertility patients. We demonstrate our analyses' potential to identify novel highly germ cell-specific markers (TSPY4 and LUZP4 for spermatogonia; HMGB4 for round spermatids) and identified putatively misregulated genes in male infertility (RWDD2A, CCDC183, CNNM1, SERF1B). Apart from these, we found thousands of genes showing germ cell-specific isoforms (including SOX15, SPATA4, SYCP3, MKI67). Our approach and dataset can help elucidate genetic and transcriptional causes for male infertility.
Siebert-Kuss LM, Krenz H, Tekath T, Wöste M, Di Persio S, Terwort N, Wyrwoll MJ, Cremers JF, Wistuba J, Dugas M, Kliesch S, Schlatt S, Tüttelmann F, Gromoll J, Neuhaus N, Laurentino S. Transcriptome analyses in infertile men reveal germ cell-specific expression and splicing patterns. Life Sci Alliance. 2022 Nov 29;6(2):e202201633. doi: 10.26508/lsa.202201633.
Publication: https://www.life-science-alliance.org/content/6/2/e202201633 Repository: https://ega-archive.org/studies/EGAS00001006135
 Disclaimer
The publication Transcriptome analyses in infertile men reveal germ cell-specific expression and splicing patterns by Siebert-Kuss LM, Krenz H, Tekath T, Wöste M, Di Persio S, Terwort N, Wyrwoll MJ, Cremers JF, Wistuba J, Dugas M, Kliesch S, Schlatt S, Tüttelmann F, Gromoll J, Neuhaus N, Laurentino S is published under an open access license: https://creativecommons.org/licenses/by/4.0/. Permits non-commercial re-use, distribution, and reproduction in any medium, provided the original work is properly cited.
Curation by the MFGA team Relevant data sets presented in the publication have been identified. If possible, annotations (title, general information, conditions, processed tissue types and processed cell types) have been added based on information from the publication. Data tables and images that provide a good overview on the publication's findings on the data set have been extracted from the publication and/or supplement. If not stated otherwise, images are depicted with title and description exactly as in the publication. Tables have been adjusted to the MFGA table format. Conducted adjustments are explained in the detailed view of the tables. However, titles and descriptions have been adopted from the publication.
Data set 1: Stage-specific gene and transcript dynamics in human germ cells
Transcriptome: Bulk RNA-Sequencing
Species
| Species |
|---|
| Human |
Tissue Types
| BRENDA tissue ontology | Maturity | Description | Species | Replicates |
|---|---|---|---|---|
| BTO_0001363: testis | Adult | A typically paired male reproductive gland that produces sperm and that in most mammals is contained within the scrotum at sexual maturity. | Human |
Cell Types
| Cell ontology | Maturity | Description | Species | Replicates | Cells per replicate |
|---|---|---|---|---|---|
| CL_0000216: Sertoli cell | Adult | A supporting cell projecting inward from the basement membrane of seminiferous tubules. They surround and nourish the developing male germ cells and secrete androgen binding protein. Their tight junctions with the spermatogonia and spermatocytes provide a blood-testis barrier. | Human | ||
| CL_0000020: spermatogonium | Adult | An euploid male germ cell of an early stage of spermatogenesis. | Human | ||
| CL_0000017: spermatocyte | Adult | A male germ cell that develops from spermatogonia. The euploid primary spermatocytes undergo meiosis and give rise to the haploid secondary spermatocytes which in turn give rise to spermatids. | Human | ||
| CL_0000018: spermatid | Adult | A male germ cell that develops from the haploid secondary spermatocytes. Without further division, spermatids undergo structural changes and give rise to spermatozoa. | Human |
Images
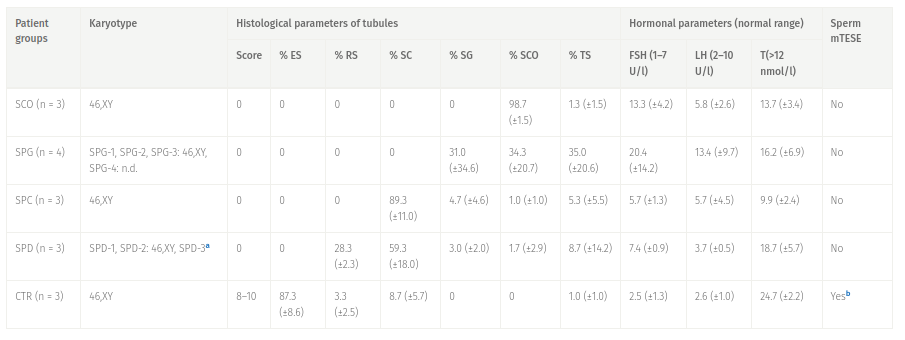
Table 1: Clinical characteristics of the patient groups.
Data are presented as mean ± SD. Percentage of tubules with the most advanced germ cell type present: elongated spermatids (%ES), round spermatids (%RS), spermatocytes (%SPC), spermatogonia (%SPG), Sertoli cell–only phenotype (%SCO), or tubular shadows (%TS). Score refers to Bergmann and Kliesch score (Bergmann & Kliesch, 2010). Hormonal parameters for follicle-stimulating hormone (FSH), luteinizing hormone (LH) and testosterone (T). -> a Patient SPD-3 had a low number of XXY karyotype mosaicism (47,XXY[2]/46,XY[28]). -> b Testicular sperm extraction (TESE) results: CTR-1 had 100/100 sperm, CTR-2 had an average of 89/100 sperm; no TESE result available for CTR-3 because the reason for surgery was a suspected malignant tumor. SCO, Sertoli cell–only; SPG, spermatogonial arrest; SPC, spermatocyte arrest; SPD, round spermatid arrest; CTR, control spermatogenesis; n.d., not determined.
Licensed under: https://creativecommons.org/licenses/by/4.0/
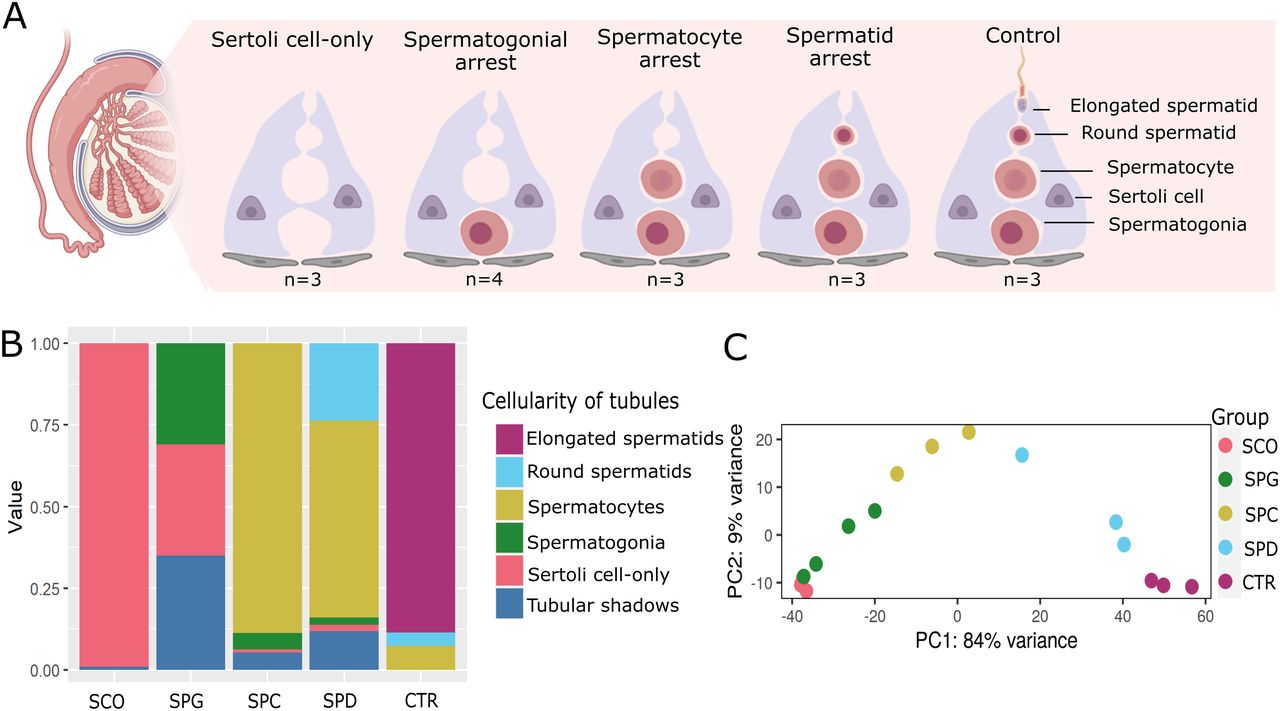
Figure 1: Cellular composition of the human testicular biopsies.
(A) Schematic illustration depicts the cellular composition of the testicular biopsies with Sertoli cell–only phenotype, arrest at the spermatogonial (SPG), spermatocyte (SPC), and spermatid (SPD) stage and samples with complete spermatogenesis, which were used as controls (CTR). (B) Stacked bar plots represent the proportional cellularity of round seminiferous tubules ranked according to the most advanced germ cell type in the tubule. The cellularity of samples from each group is averaged. (C) Principal component analysis (PCA) plot depicts clustering of the total RNA–sequenced samples based on the top 500 genes.
Licensed under: https://creativecommons.org/licenses/by/4.0/
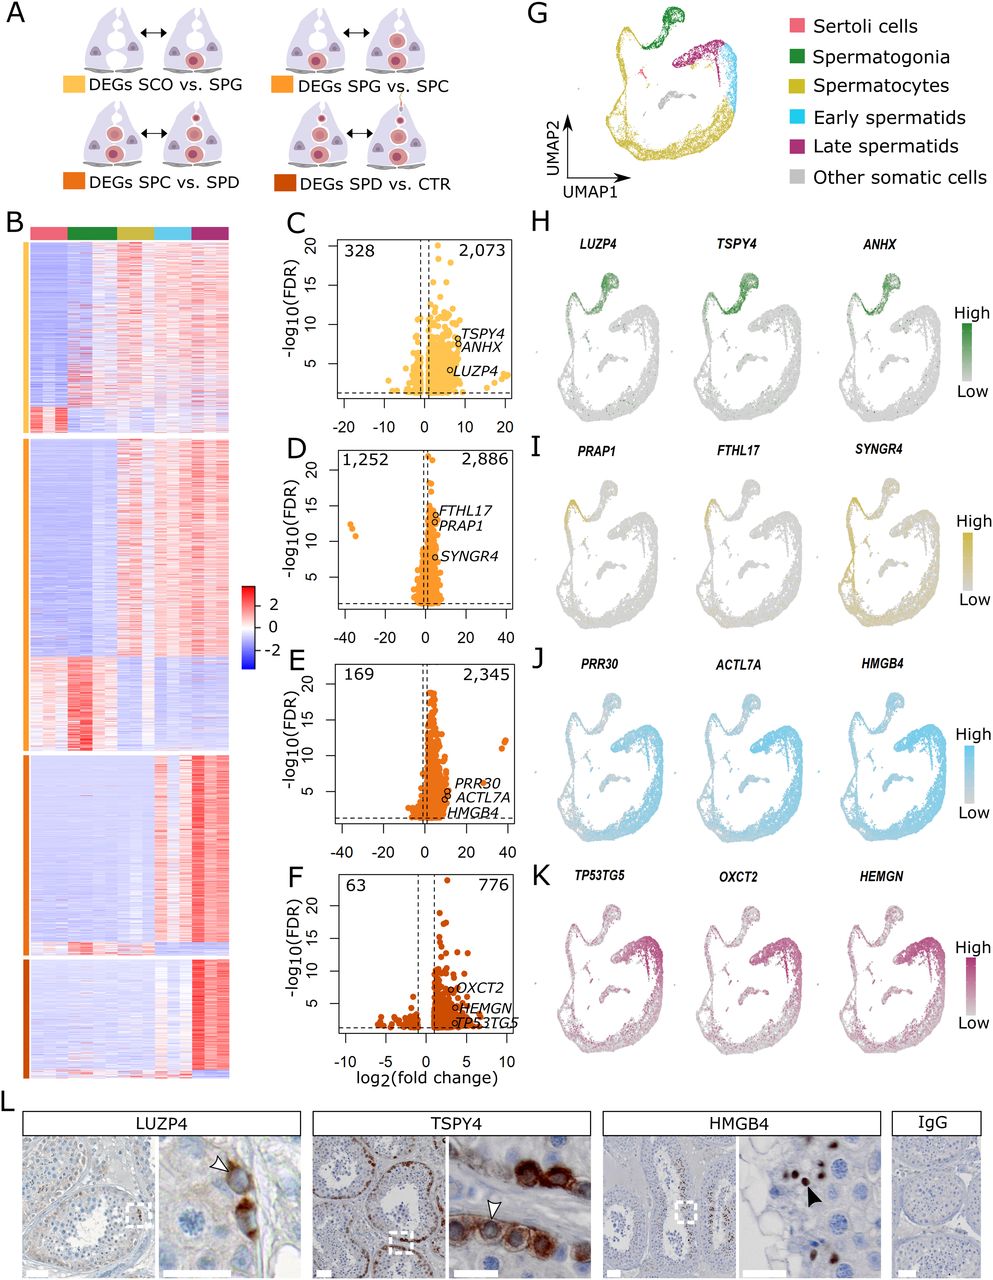
Figure 2: Examination of germ cell–specific gene expression.
(A) Schematic illustration of the group comparisons and the respective color codes of their differentially expressed genes (DEGs). (B) The heat map displays the normalized expression counts of the DEGs (rows) of each group comparisons across all samples (columns) scaled via a row Z-score. Red = increased; blue = decreased. (C, D, E, F) Volcano plots of the increased and decreased genes in samples with (C) spermatogonial, (D) spermatocyte, (E) and spermatid arrest and in (F) complete spermatogenesis. (G) UMAP plot depicts 15,546 cells integrated from three patients with obstructive azoospermia and complete spermatogenesis (Di Persio et al, 2021). (H, I, J, K) Feature plots show the expression of three novel genes for (H) spermatogonia, (I) spermatocytes, (J) round spermatids, and (K) elongated spermatids at single-cell level. (L) Micrographs showing immunohistochemical stainings for LUZP4, TSPY4, and HMGB4 in testicular tissue with full spermatogenesis (n = 3). Arrow heads in the inlays indicate positive spermatogonia (white) and round spermatids (black). IgG control shows no staining. Scale bars = 50 μm for micrographs and 20 μm for inlays. Data information: genes with a false discovery rate (FDR) < 0.05 and a log2 fold change (FC) ≥ 1 were considered DEGs based on Wald test and adjusted with Benjamini–Hochberg.
Licensed under: https://creativecommons.org/licenses/by/4.0/
Figure 3: Comparison of differentially expressed gene (DEG) and differential trascript usage (DTU) gene numbers in all four group comparisons.
(A, B, C, D) Venn diagrams display number and proportion of genes that are differentially expressed, have a DTU event, or both in the (A) Sertoli cell–only versus SPG, (B) SPG versus SPC, (C) SPC versus SPD, and (D) SPD versus CTR group comparisons. Yellow = differential gene expressions, blue = DTU genes.
Licensed under: https://creativecommons.org/licenses/by/4.0/
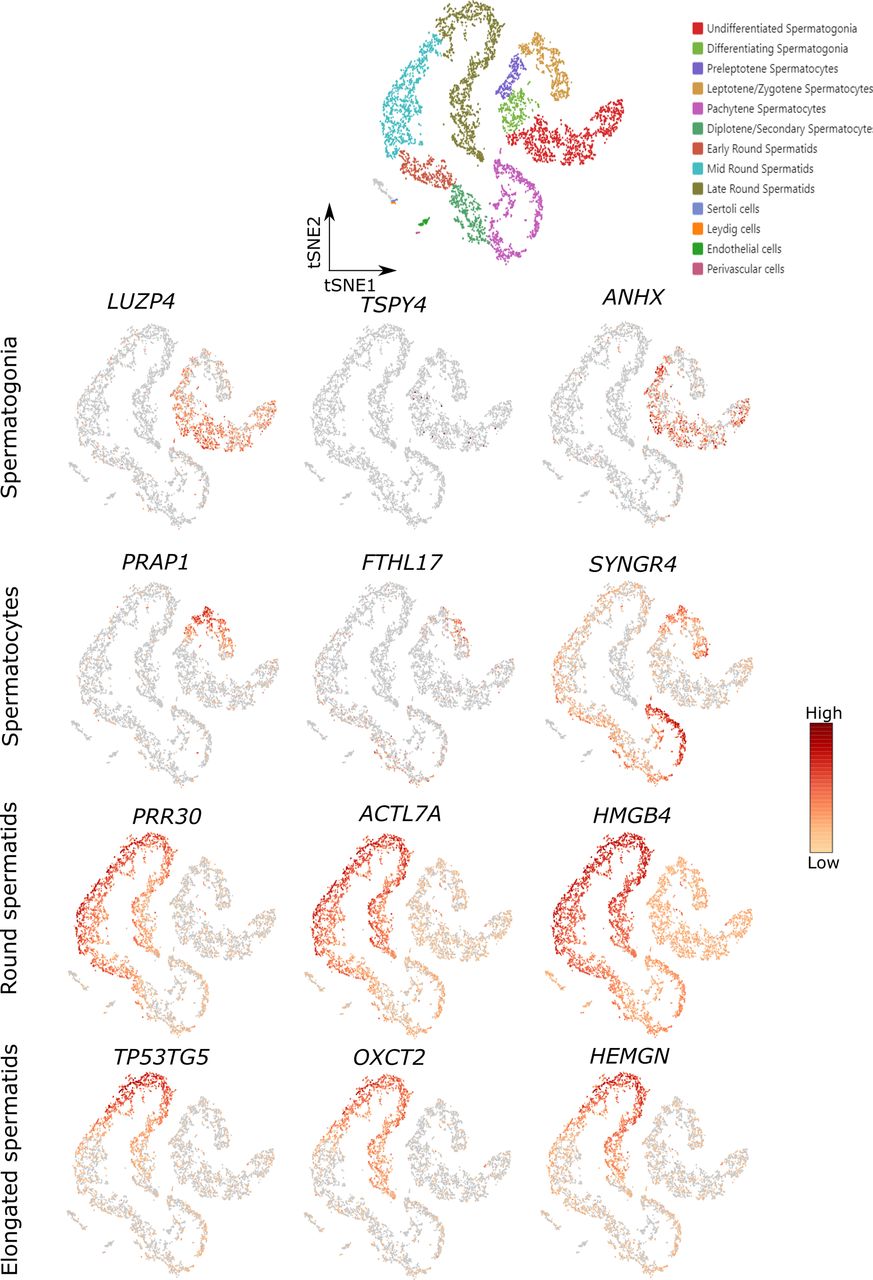
Figure 4: Molecular functions of differentially expressed genes (DEGs) and differential trascript usage (DTU) genes.
(A, B) Heat maps displaying the molecular functions revealed by IPA of all (A) DEGs and (B) DTU genes per group comparisons according to the −log10 P-values. The top 20 molecular functions of each group comparison with P-values < 0.01 were included. * Molecular functions enriched in both the DEG and DTU gene sets.
Licensed under: https://creativecommons.org/licenses/by/4.0/
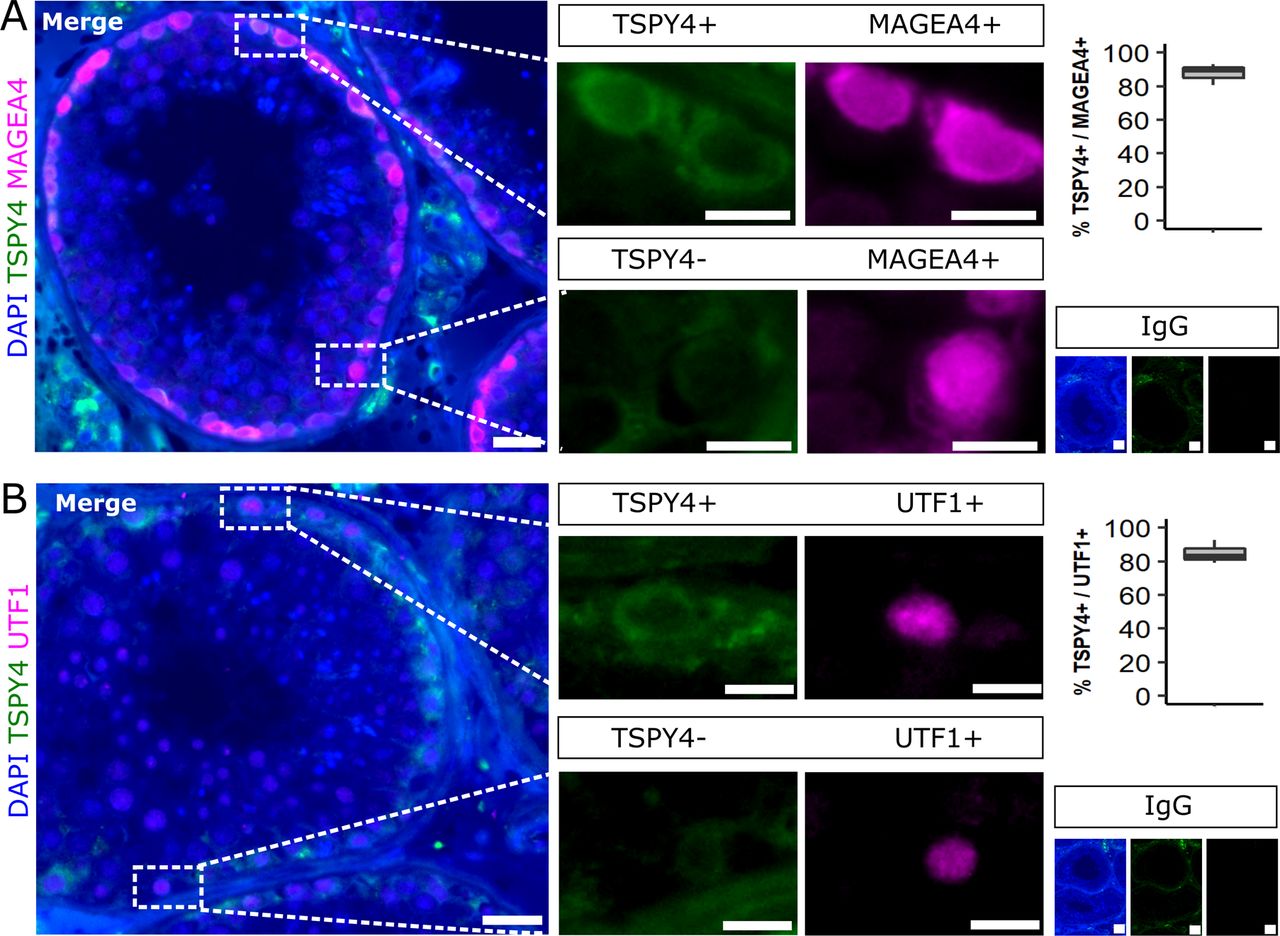
Figure 5: Transcript biotypes with differential transcript usage (DTU) events.
(A) Stacked bar plots represent the relative amount of different transcript biotypes with DTU events in each of the four group comparisons compared with the transcript biotype annotation from the GENCODE release 36 genome annotation based on the GRCh38.p13 genome reference (Frankish et al, 2019). (B) Schematic illustration of the groups and the respective color codes. (C, D, E, F) Schematic representation of the transcript isoforms with a DTU event, which predominantly contribute to the relative change in isoform usage (box plots of proportion), independent of gene expression (boxplots of normalized counts) in (C) SOX15, (D) SPATA4, (E) SYCP3, and (F) MKI67. P-values refer to specific transcripts that significantly drive the change in isoform usage in genes with an overall significant change in transcript usage. In (C, D, E, F), data are represented as median (center line), upper/lower quartiles (box limits), 1.5× interquartile range (whiskers), and outliers (points). Likelihood ratio test: **P ≤ 0.01, ***P ≤ 0.001. Exons/coding region = boxes, UTR = smaller boxes, introns = lines. SPG: n = 4; SPC: n = 3, SPD: n = 3.
Licensed under: https://creativecommons.org/licenses/by/4.0/