Single-cell analysis of human testis aging and correlation with elevated body mass index
Nie X, Munyoki SK, Sukhwani M, Schmid N, Missel A, Emery BR, DonorConnect, Stukenborg JB, Mayerhofer A, Orwig KE, Aston KI, Hotaling JM, Cairns BR, Guo J, 09.05.2022
Abstract
Aging men display reduced reproductive health; however, testis aging is poorly understood at the molecular and genomic levels. Here, we utilized single-cell RNA-seq to profile over 44,000 cells from both young and older men and examined age-related changes in germline development and in the testicular somatic cells. Age-related changes in spermatogonial stem cells appeared modest, whereas age-related dysregulation of spermatogenesis and somatic cells ranged from moderate to severe. Altered pathways included signaling and inflammation in multiple cell types, metabolic signaling in Sertoli cells, hedgehog signaling and testosterone production in Leydig cells, cell death and growth in testicular peritubular cells, and possible developmental regression in both Leydig and peritubular cells. Remarkably, the extent of dysregulation correlated with body mass index in older but not in younger men. Collectively, we reveal candidate molecular mechanisms underlying the complex testicular changes conferred by aging and their possible exacerbation by concurrent chronic conditions such as obesity.
Nie X, Munyoki SK, Sukhwani M, Schmid N, Missel A, Emery BR, DonorConnect, Stukenborg JB, Mayerhofer A, Orwig KE, Aston KI, Hotaling JM, Cairns BR, Guo J. Single-cell analysis of human testis aging and correlation with elevated body mass index. Dev Cell. 2022 May 9;57(9):1160-1176.e5. doi: 10.1016/j.devcel.2022.04.004. Epub 2022 May 2. PMID: 35504286; PMCID: PMC9090997.
Publication: https://doi.org/10.1016/j.devcel.2022.04.004 Repository: https://www.ncbi.nlm.nih.gov/geo/query/acc.cgi?acc=GSE182786
 Disclaimer
The publication Single-cell analysis of human testis aging and correlation with elevated body mass index by Nie X, Munyoki SK, Sukhwani M, Schmid N, Missel A, Emery BR, DonorConnect, Stukenborg JB, Mayerhofer A, Orwig KE, Aston KI, Hotaling JM, Cairns BR, Guo J is published under an open access license: https://creativecommons.org/licenses/by-nc-nd/4.0/. Permits non-commercial re-use, distribution, and reproduction in any medium, provided the original work is properly cited.
Curation by the MFGA team Relevant data sets presented in the publication have been identified. If possible, annotations (title, general information, conditions, processed tissue types and processed cell types) have been added based on information from the publication. Data tables and images that provide a good overview on the publication's findings on the data set have been extracted from the publication and/or supplement. If not stated otherwise, images are depicted with title and description exactly as in the publication. Tables have been adjusted to the MFGA table format. Conducted adjustments are explained in the detailed view of the tables. However, titles and descriptions have been adopted from the publication.
Data set 1: Single-cell transcriptomes of testes of young and older men
Transcriptome: Single-cell RNA-Sequencing
Species
| Species |
|---|
| Human |
Tissue Types
| BRENDA tissue ontology | Maturity | Description | Species | Replicates |
|---|---|---|---|---|
| BTO_0001363: testis | Young (17 to 22 years, have complete spermatogenesis) | A typically paired male reproductive gland that produces sperm and that in most mammals is contained within the scrotum at sexual maturity. | Human | 4 |
| BTO_0001363: testis | Old (62 to 76 years, had offspring) | A typically paired male reproductive gland that produces sperm and that in most mammals is contained within the scrotum at sexual maturity. | Human | 8 |
Images
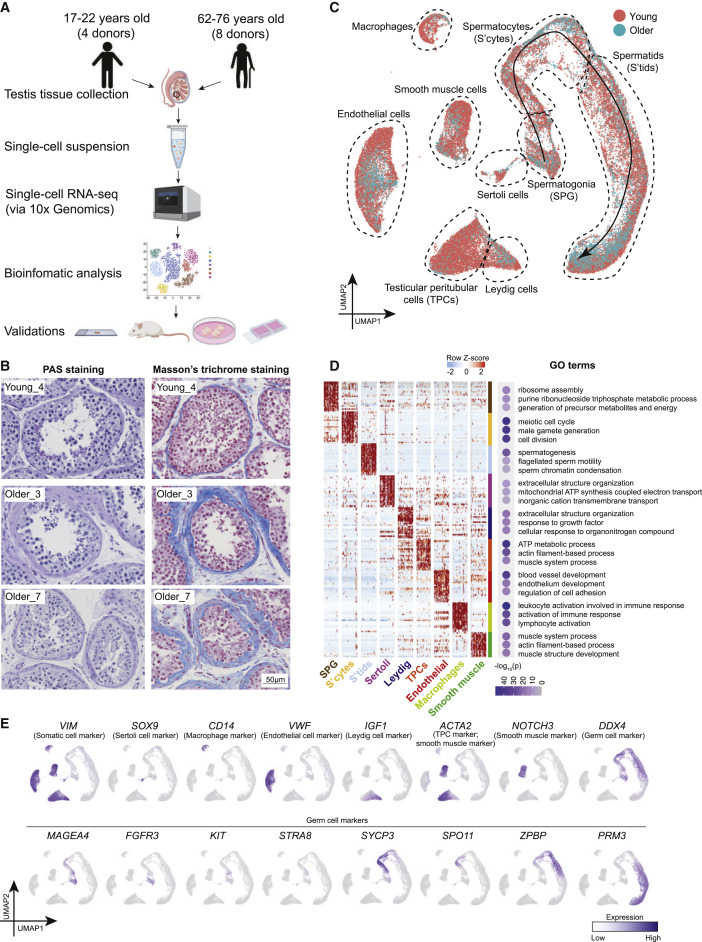
Figure 1. Single-cell transcriptome profile of testicular cells from young and older men
(A) Schematic of the experimental workflow. (B) Periodic acid-Schiff (PAS) staining (left) and Masson’s trichrome staining (right) of sections of testes from young and older donors, respectively, demonstrating morphological changes during aging and variations among older human testes. (C) A UMAP plot showing the annotated testicular cell types from both young and older men (n = 12). Each dot represents a single testicular cell and is colored based on its donor of origin. (D) Left: heatmap showing the top 200 differentially expressed genes of each cell cluster from (C). The scaled gene expression levels are colored according to Z score. Right: the corresponding top three GO terms enriched in the marker genes of each cell cluster with −log10(p value) colored according to the color key at the bottom. (E) Expression of selected markers identifying major testicular cell types cast on the UMAP plot. Purple (or gray) represents a high (or low) expression level as shown on the color key at the right bottom.
Licensed under: https://creativecommons.org/licenses/by-nc-nd/4.0/
Data set 2: Analysis of aging in spermatogonia
Transcriptome: Single-cell RNA-Sequencing
Cell Types
| Cell ontology | Maturity | Description | Species | Replicates | Cells per replicate |
|---|---|---|---|---|---|
| CL_0000016: male germ line stem cell | Adult | A stem cell that is the precursor of male gametes. | Human | ||
| CL_0000020: spermatogonium | Adult | differentiating spermatogonia | Human | ||
| CL_0000656: primary spermatocyte | Adult | early primary spermatocyte | Human | ||
| CL_0000656: primary spermatocyte | Adult | late primary spermatocyte | Human | ||
| CL_4030036: early spermatid | Adult | round spermatids | Human | ||
| CL_4030037: late spermatid | Adult | elongated spermatids | Human | ||
| CL_4030036: early spermatid | Adult | elongating spermatids | Human |
Images

Figure 2. Strong variation in spermatogenic dynamics observed in men with advanced age
(A) A UMAP plot showing the annotated germ cells captured from Figure 1C. (B) Expression patterns of selected markers cast on the UMAP plot in Figure 2A. Purple (or gray) represents a high (or low) expression level as shown on the color key at the right bottom. (C) Deconvolution of the UMAP plot of Figure 2A according to donors of origin. (D) Bar plot showing the percentage of major germ cell types for each individual. Older donors with complete spermatogenesis are classified as Older Group1, whereas older donors with spermatogenic impairment are classified as Older Group2. (E) Left: immunofluorescence images of a State 0 marker, PIWIL4 (red), across three donor groups. Nuclei were counterstained with DAPI (blue). Right: quantification of the number of PIWIL4-positive cells in cross-section of each seminiferous tubule in different groups. Bars represent the mean, with standard deviation (SD) of 20 independent tubules per group. n = 6 human samples. ns, no significance. ∗∗∗∗p < 0.0001 (two-tailed t test). Scale bars, 50 μm. (F) Left: immunofluorescence images of a State 0/1 marker, UTF1 (red), across three donor groups. Nuclei were counterstained with DAPI (blue). Right: quantification of the number of UTF1-positive cells in cross-section of each seminiferous tubule in different groups. Bars represent the mean with SD of 20 independent tubules per group. n = 6 human samples. ns, no significance. ∗∗∗∗p < 0.0001 (two-tailed t test). Scale bars, 50 μm. (G) Top: schematic of the human to nude mouse xenotransplantation experiment. Bottom left: immunofluorescence images of whole-mount staining of recipient mouse testes, using an antiprimate antibody. Human spermatogonia colonies were observed after 2 months of xenotransplant. Scale bars, 50 μm. Bottom right: quantification of the number of colonies per 105 viable cells transplanted per testis in different groups. Bars represent the mean with SD. n = 9 human samples.
Licensed under: https://creativecommons.org/licenses/by-nc-nd/4.0/
Data set 3: Global alterations of the testicular somatic cells and somatic cell-germline interactions in the aging human testis
Transcriptome: Single-cell RNA-Sequencing
Cell Types
| Cell ontology | Maturity | Description | Species | Replicates | Cells per replicate |
|---|---|---|---|---|---|
| CL_0002371: somatic cell | Adult | A cell of an organism that does not pass on its genetic material to the organism's offspring (i.e. a non-germ line cell). | Human |
Images
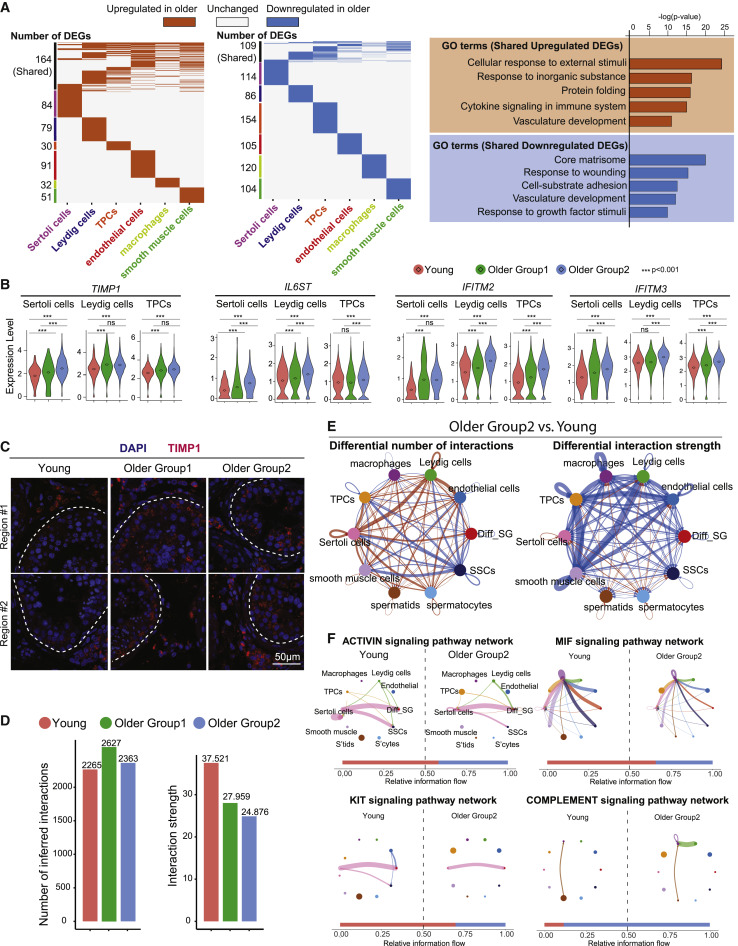
Figure 3. Global alterations of the testicular somatic cells and somatic-germline interactions in older human testes
(A) Left: heatmap showing common and unique upregulated DEGs between young and older men in each major testicular somatic cell type. Middle: heatmap showing common and unique downregulated DEGs between young and older men in each major testicular somatic cell type. Right: representative GO terms of shared upregulated (top) or downregulated (bottom) DEGs between young and older somatic cells and their associated p value. (B) Violin plots showing upregulated DEGs of older testicular somatic cells related to inflammation. Diamond inside the violin represents the mean. (C) Immunofluorescence images of TIMP1 (red) show the elevated TIMP1 staining signal in older testes. Nuclei were counterstained with DAPI (blue). Dashed lines indicate seminiferous tubule membranes. Two donors from each group are shown. Scale bars, 50 μm. (D) Bar plots showing the number of inferred interactions (left) or interaction strength (right) in the cell-cell communication network analyzed by CellChat across the three groups. (E) Circle plots (by CellChat analysis) depict the differential number of interactions (left) or interaction strength (right) in the cell-cell communication network between Young and Older Group2, respectively, indicating SSCs lose interactions with testicular somatic cells during aging. Red or blue edges represent increased or decreased signaling in Older Group2 compared with young, respectively. (F) Circle plots showing selected inferred differential signaling networks. The edge width represents the communication probability. Bar graph at the bottom of each panel illustrates representative information flow in Older Group2 (blue) and Young (red).
Licensed under: https://creativecommons.org/licenses/by-nc-nd/4.0/
Data set 4: Sertoli cells display inflammation and metabolic dysregulation during aging
Transcriptome: Single-cell RNA-Sequencing
Cell Types
| Cell ontology | Maturity | Description | Species | Replicates | Cells per replicate |
|---|---|---|---|---|---|
| CL_0000216: Sertoli cell | Adult | A supporting cell projecting inward from the basement membrane of seminiferous tubules. They surround and nourish the developing male germ cells and secrete androgen binding protein. Their tight junctions with the spermatogonia and spermatocytes provide a blood-testis barrier. | Human |
Images
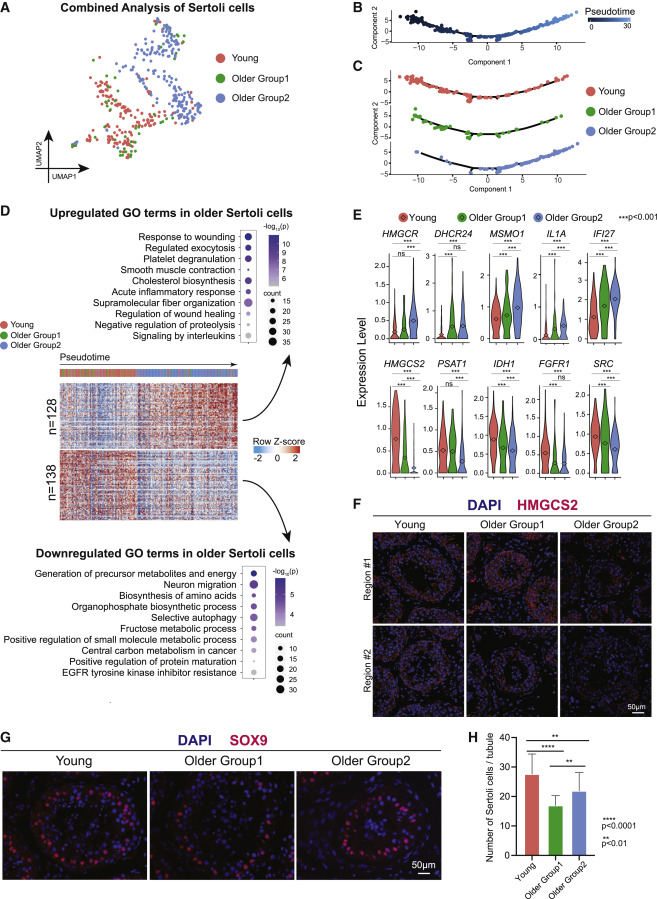
Figure 4. Sertoli cells from older men display metabolic dysregulation
(A) UMAP plot showing focused analysis of Sertoli cells from Figure 1C. (B) Pseudotime trajectory of Sertoli cells analyzed by Monocle. (C) Deconvolution of pseudotime trajectory of Figure 4B according to young/older groups, predicting gradual change from young through Older Group1 to Older Group2. (D) Heatmap showing both upregulated and downregulated DEGs in older groups of Sertoli cells with columns/cells placed in pseudotime order defined in Figure 4C. The scaled gene expression levels are colored according to Z score. The top 10 upregulated or downregulated GO terms enriched in the DEGs are listed with p value and gene numbers. (E) Violin plots showing upregulated DEGs of older Sertoli cells on the top panel and downregulated DEGs of older Sertoli cells at the bottom panel. The diamond inside the violin plot represents the mean. (F) Immunofluorescence images of HMGCS2 (red) in different groups show a significant decrease in staining signal in Older Group2 testes. Nuclei were counterstained with DAPI (blue). Two donors from each group are shown. Scale bars, 50 μm. (G) Immunofluorescence images of a Sertoli cell marker, SOX9 (red), in different groups (Young, Older Group1, and Older Group2). Nuclei were counterstained with DAPI (blue). Scale bars, 50 μm. (H) Quantification of the number of Sertoli cells (SOX9 positive) in cross-section of each seminiferous tubule in different groups. Bars represent the mean with SD of 20 independent tubules per group. n = 6 human samples. ∗∗∗∗p < 0.0001, ∗∗p < 0.01 (two-tailed t test).
Licensed under: https://creativecommons.org/licenses/by-nc-nd/4.0/
Data set 5: Leydig cells display dysregulation in signaling, testosterone and developmental identity
Transcriptome: Single-cell RNA-Sequencing
Cell Types
| Cell ontology | Maturity | Description | Species | Replicates | Cells per replicate |
|---|---|---|---|---|---|
| CL_0000178: Leydig cell | Adult | A Leydig cell is a testosterone-secreting cell in the interstitial area, between the seminiferous tubules, in the testis. | Human |
Images
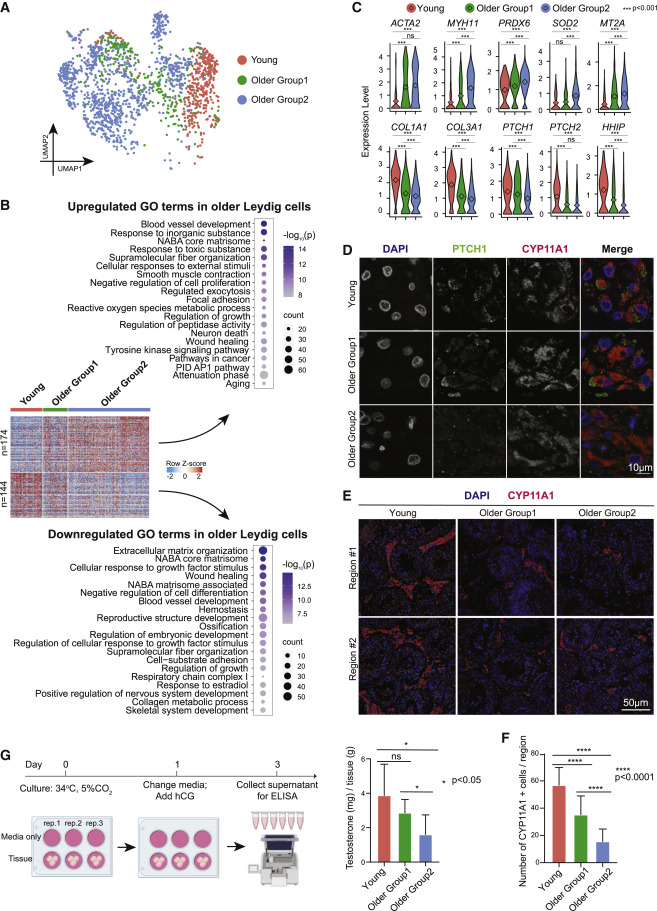
Figure 5. Leydig cells from older men display declined functionality, including lower production of testosterone
(A) UMAP plot showing focused analysis of Leydig cells from Figure 1C. (B) Heatmaps showing both upregulated and downregulated DEGs in older Leydig cells. The scaled gene expression levels are colored according to Z score. The top 20 upregulated or downregulated GO terms enriched in the DEGs are listed with p value and gene numbers. (C) Violin plots showing upregulated DEGs of older Leydig cells within the top panel and downregulated DEGs of older Leydig cells within the bottom panel. The diamond inside the violin plot represents the mean. (D) Immunofluorescence images of PTCH1 (green) with a Leydig cell marker, CYP11A1 (red) in different groups, revealing decreased PTCH1 expression in older Leydig cells. Nuclei were counterstained with DAPI (blue). Two donors from each group are shown. Scale bars, 10 μm. (E) Immunofluorescence images of a Leydig cell marker, CYP11A1 (red), in different groups. Nuclei were counterstained with DAPI (blue). Two donors from each group are shown. Scale bars, 50 μm. (F) Quantification of the number of Leydig cells (CYP11A1 positive) in cross-section of each microscopic field (0.04 mm2) in different groups, demonstrating reduced Leydig cells during aging. Bars represent the mean with SD of 20 independent tubules per group. n = 6 human samples. ∗∗∗∗p < 0.0001 (two-tailed t test). (G) Left: schematic of tissue explant culture used to test testosterone production of older Leydig cells. Right: quantification of testosterone production in Young, Older Group1, and Older Group2, indicating older testes produce less testosterone. Bars represent the mean with SD of 9 donors with 3 technical replicates per sample. ∗p < 0.05, ns: no significance (two-tailed t test).
Licensed under: https://creativecommons.org/licenses/by-nc-nd/4.0/
Data set 6: Aging testicular peritubular cells show dysregulated cell death, matrisome, developmental pathways and contractility
Transcriptome: Single-cell RNA-Sequencing
Cell Types
| Cell ontology | Maturity | Description | Species | Replicates | Cells per replicate |
|---|---|---|---|---|---|
| CL_0002481: peritubular myoid cell | Adult | The flattened smooth myoepithelial cells of mesodermal origin that lie just outside the basal lamina of the seminiferous tubule. | Human |
Images
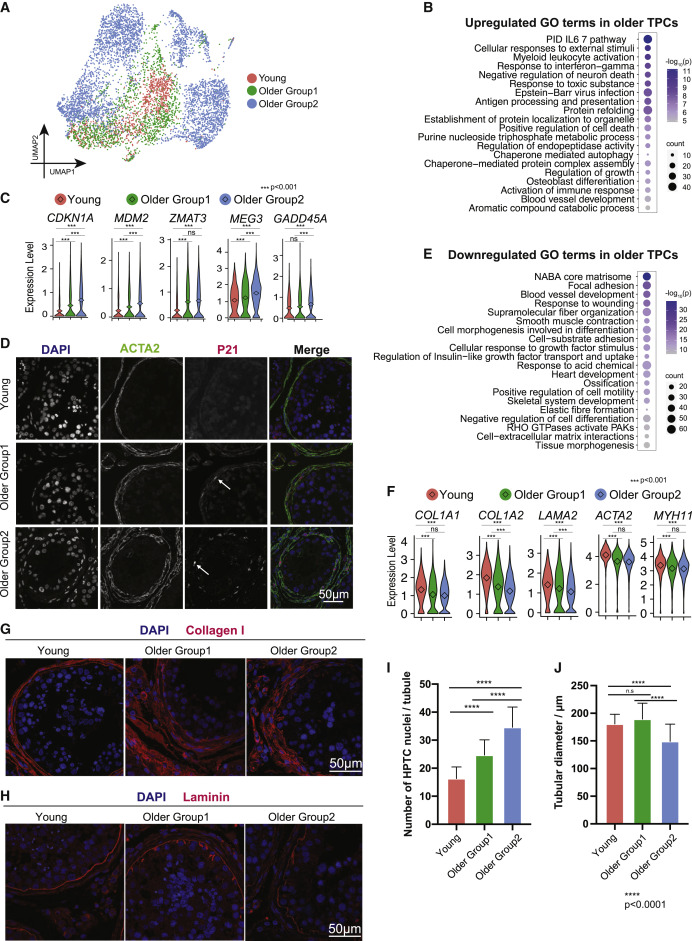
Figure 6. TPCs display morphological and functional alternations in older testes
(A) UMAP plot showing focused analysis of TPCs from Figure 1C. (B) Dot plot showing the top 20 upregulated GO terms enriched in the DEGs of older TPCs with p value and gene numbers. (C) Violin plots with mean expression level highlighted inside showing upregulated DEGs of older TPCs. (D) Immunofluorescence images of p21 (encoded by CDKN1A, red) with a TPC marker, ACTA2 (green), in different groups, revealing increased p21 expression in older TPC cells. Nuclei were counterstained with DAPI (blue). Arrows indicate p21 positive cells. n = 6 human samples. Scale bars, 50 μm. (E) Dot plot showing the top 20 downregulated GO terms in older TPCs with p value and gene numbers. (F) Violin plots showing downregulated DEGs of older TPCs. The diamond inside the violin plot represents the mean. (G) Immunofluorescence images of Collagen I (red), revealing increased Collagen I deposition in older PTC cells. n = 6 human samples. Scale bars, 50 μm. (H) Immunofluorescence images of laminin (red), revealing abnormal laminin deposition in older PTC cells. n = 6 human samples. Scale bars, 50 μm. (I) Quantification of the number of TPCs in cross-section of each seminiferous tubule in different groups, revealing a progressive increase in the numbers of TPCs around the walls of seminiferous tubules from young through Older Group1 to Older Group2. Bars represent the mean with SD of 20 independent tubules per group. n = 6 human samples. ∗∗∗∗p < 0.0001, ∗∗p < 0.01 (two-tailed t test). (J) Quantification of the diameter of seminiferous tubules in different groups. Bars represent the mean with SD of 20 independent tubules per group. n = 6 human samples. ∗∗∗∗p < 0.0001, ∗∗p < 0.01 (two-tailed t test).
Licensed under: https://creativecommons.org/licenses/by-nc-nd/4.0/