The molecular evolution of spermatogenesis across mammals
Murat F, Mbengue N, Winge SB, Trefzer T, Leushkin E, Sepp M, Cardoso-Moreira M, Schmidt J, Schneider C, Mößinger K, Brüning T, Lamanna F, Belles MR, Conrad C, Kondova I, Bontrop R, Behr R, Khaitovich P, Pääbo S, Marques-Bonet T, Grützner F, Almstrup K, Schierup MH, Kaessmann H, 21.12.2022
Abstract
The testis produces gametes through spermatogenesis and evolves rapidly at both the morphological and molecular level in mammals, probably owing to the evolutionary pressure on males to be reproductively successful. However, the molecular evolution of individual spermatogenic cell types across mammals remains largely uncharacterized. Here we report evolutionary analyses of single-nucleus transcriptome data for testes from 11 species that cover the three main mammalian lineages (eutherians, marsupials and monotremes) and birds (the evolutionary outgroup), and include seven primates. We find that the rapid evolution of the testis was driven by accelerated fixation rates of gene expression changes, amino acid substitutions and new genes in late spermatogenic stages, probably facilitated by reduced pleiotropic constraints, haploid selection and transcriptionally permissive chromatin. We identify temporal expression changes of individual genes across species and conserved expression programs controlling ancestral spermatogenic processes. Genes predominantly expressed in spermatogonia (germ cells fuelling spermatogenesis) and Sertoli (somatic support) cells accumulated on X chromosomes during evolution, presumably owing to male-beneficial selective forces. Further work identified transcriptomal differences between X- and Y-bearing spermatids and uncovered that meiotic sex-chromosome inactivation (MSCI) also occurs in monotremes and hence is common to mammalian sex-chromosome systems. Thus, the mechanism of meiotic silencing of unsynapsed chromatin, which underlies MSCI, is an ancestral mammalian feature. Our study illuminates the molecular evolution of spermatogenesis and associated selective forces, and provides a resource for investigating the biology of the testis across mammals.
Murat F, Mbengue N, Winge SB, Trefzer T, Leushkin E, Sepp M, Cardoso-Moreira M, Schmidt J, Schneider C, Mößinger K, Brüning T, Lamanna F, Belles MR, Conrad C, Kondova I, Bontrop R, Behr R, Khaitovich P, Pääbo S, Marques-Bonet T, Grützner F, Almstrup K, Schierup MH, Kaessmann H. The molecular evolution of spermatogenesis across mammals. Nature. 2023 Jan;613(7943):308-316. doi: 10.1038/s41586-022-05547-7. Epub 2022 Dec 21. PMID: 36544022; PMCID: PMC9834047.
Publication: https://doi.org/10.1038%2Fs41586-022-05547-7
 Disclaimer
The publication The molecular evolution of spermatogenesis across mammals by Murat F, Mbengue N, Winge SB, Trefzer T, Leushkin E, Sepp M, Cardoso-Moreira M, Schmidt J, Schneider C, Mößinger K, Brüning T, Lamanna F, Belles MR, Conrad C, Kondova I, Bontrop R, Behr R, Khaitovich P, Pääbo S, Marques-Bonet T, Grützner F, Almstrup K, Schierup MH, Kaessmann H is published under an open access license: http://creativecommons.org/licenses/by/4.0/. Permits non-commercial re-use, distribution, and reproduction in any medium, provided the original work is properly cited.
Curation by the MFGA team Relevant data sets presented in the publication have been identified. If possible, annotations (title, general information, conditions, processed tissue types and processed cell types) have been added based on information from the publication. Data tables and images that provide a good overview on the publication's findings on the data set have been extracted from the publication and/or supplement. If not stated otherwise, images are depicted with title and description exactly as in the publication. Tables have been adjusted to the MFGA table format. Conducted adjustments are explained in the detailed view of the tables. However, titles and descriptions have been adopted from the publication.
Data set 1: snRNA profiling across ten mammals and a bird
Transcriptome: Single-nucleus RNA Sequencing
Species
| Species |
|---|
| Human, Chimpanzee, Bonobo, Gorilla, Gibbon, Macaque, Marmoset, Mouse, Opossum, Platypus, Chicken |
Tissue Types
| BRENDA tissue ontology | Maturity | Description | Species | Replicates |
|---|---|---|---|---|
| BTO_0001363: testis | Adult | A typically paired male reproductive gland that produces sperm and that in most mammals is contained within the scrotum at sexual maturity. | Human, Chimpanzee, Bonobo, Gorilla, Gibbon, Macaque, Marmoset, Mouse, Opossum, Platypus, Chicken |
Cell Types
| Cell ontology | Maturity | Description | Species | Replicates | Cells per replicate |
|---|---|---|---|---|---|
| CL_0000020: spermatogonium | An euploid male germ cell of an early stage of spermatogenesis. | Human, Chimpanzee, Bonobo, Gorilla, Gibbon, Macaque, Marmoset, Mouse, Opossum, Platypus, Chicken | |||
| CL_0000017: spermatocyte | A male germ cell that develops from spermatogonia. The euploid primary spermatocytes undergo meiosis and give rise to the haploid secondary spermatocytes which in turn give rise to spermatids. | Human, Chimpanzee, Bonobo, Gorilla, Gibbon, Macaque, Marmoset, Mouse, Opossum, Platypus, Chicken | |||
| CL_0000018: spermatid | A male germ cell that develops from the haploid secondary spermatocytes. Without further division, spermatids undergo structural changes and give rise to spermatozoa. | Human, Chimpanzee, Bonobo, Gorilla, Gibbon, Macaque, Marmoset, Mouse, Opossum, Platypus, Chicken | |||
| CL_0000216: Sertoli cell | A supporting cell projecting inward from the basement membrane of seminiferous tubules. They surround and nourish the developing male germ cells and secrete androgen binding protein. Their tight junctions with the spermatogonia and spermatocytes provide a blood-testis barrier. | Human, Chimpanzee, Bonobo, Gorilla, Gibbon, Macaque, Marmoset, Mouse, Opossum, Platypus, Chicken | |||
| CL_0002371: somatic cell | A cell of an organism that does not pass on its genetic material to the organism's offspring (i.e. a non-germ line cell). | Human, Chimpanzee, Bonobo, Gorilla, Gibbon, Macaque, Marmoset, Mouse, Opossum, Platypus, Chicken |
Images
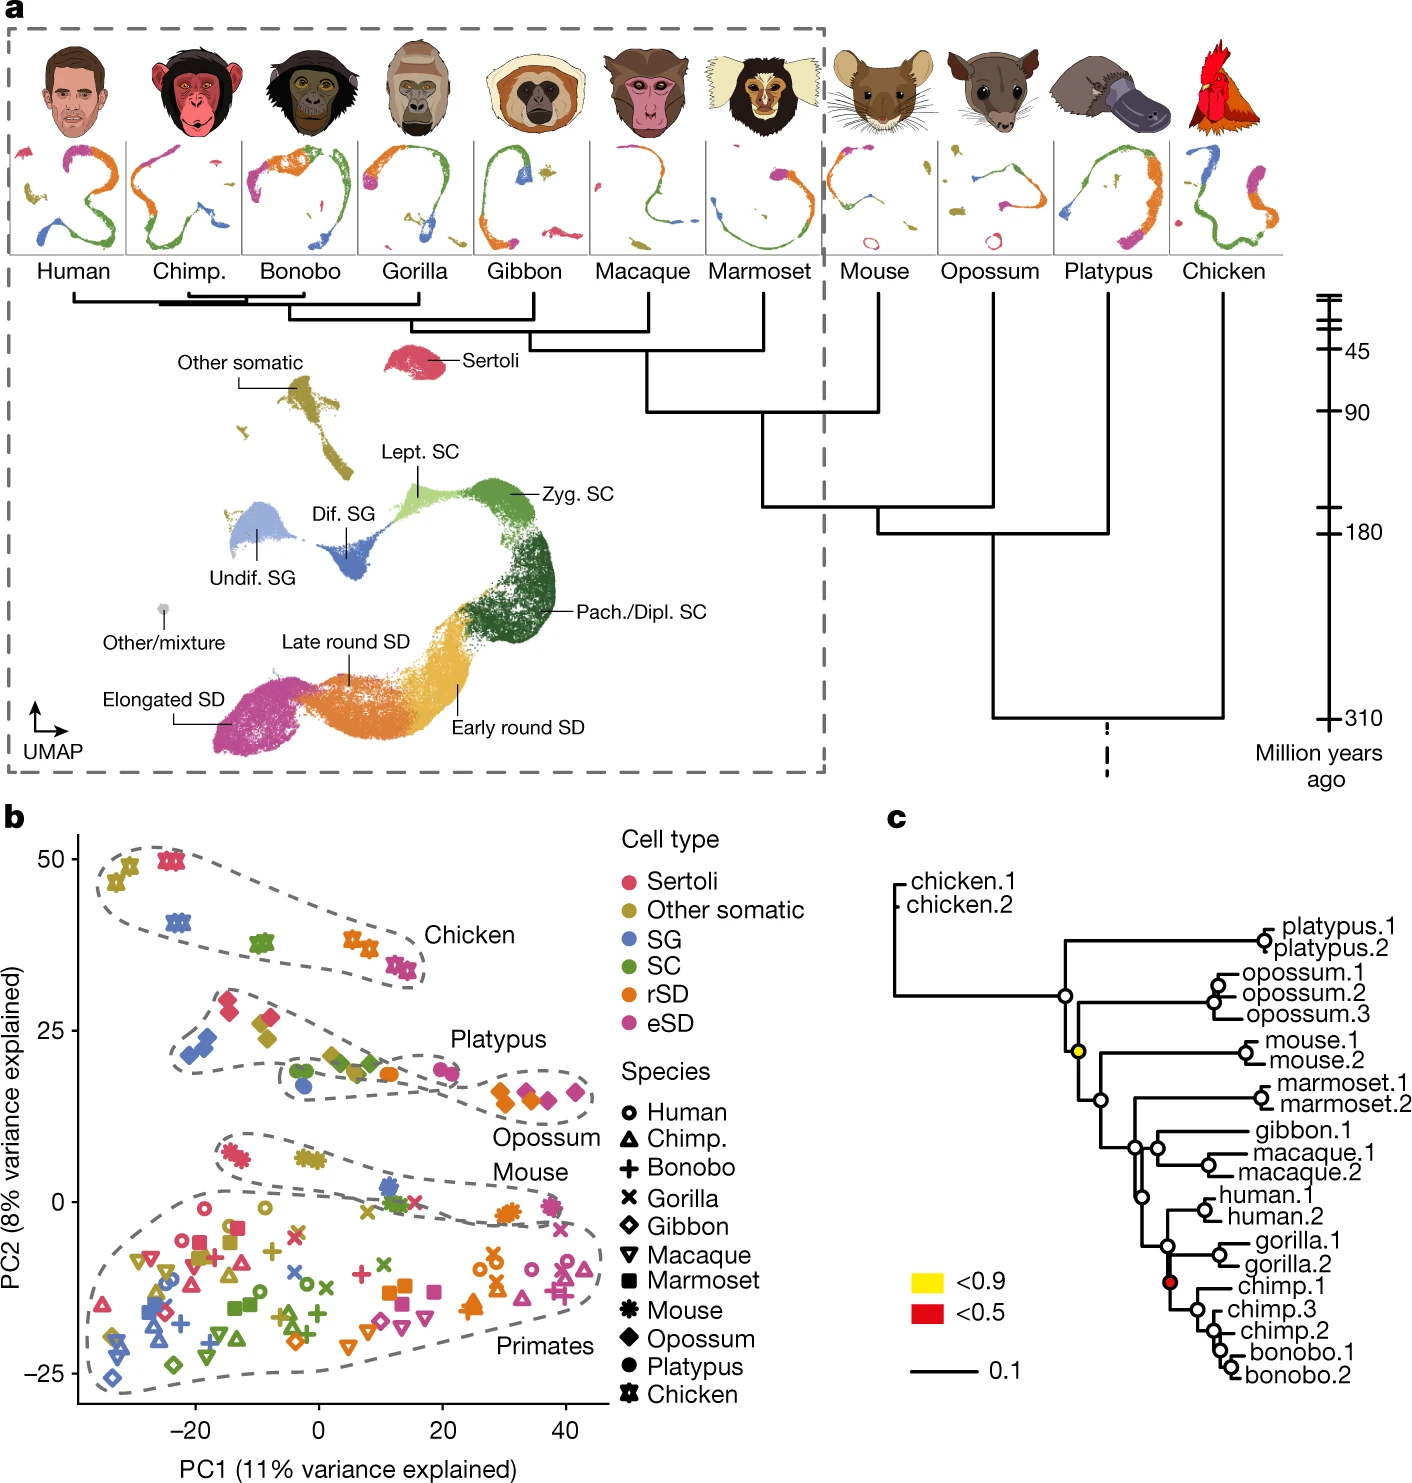
Figure 1: snRNA profiling across ten mammals and a bird
a, Species sampled and uniform manifold approximation and projection (UMAP) of snRNA-seq datasets. UMAP of the integrated primate dataset (dashed box), showing undifferentiated and differentiated SG (undif. SG and dif. SG, respectively), leptotene, zygotene, pachytene and diplotene SCs (lept. SC, zyg. SC, pach. SC and dipl. SC, respectively), spermatids (SD) and somatic cell types. Chimp., chimpanzee. b, Principal component (PC) analysis of cell-type pseudo-bulks. Species and lineages are encircled by a dashed line. Each symbol represents an individual. c, Gene expression phylogeny based on pseudo-bulk transcriptomes for whole testes. Bootstrap values (4,498 1:1 orthologous amniote genes were randomly sampled with replacement 1,000 times) are indicated by circles, ≥0.9 (white fill).
Licensed under: http://creativecommons.org/licenses/by/4.0/
Data set 2: Rates of evolution along spermatogenesis and evolutionary forces
Transcriptome: Single-nucleus RNA Sequencing
Species
| Species |
|---|
| Human, Chimpanzee, Bonobo, Gorilla, Gibbon, Macaque, Marmoset, Mouse, Opossum, Platypus, Chicken |
Tissue Types
| BRENDA tissue ontology | Maturity | Description | Species | Replicates |
|---|---|---|---|---|
| BTO_0001363: testis | Adult | A typically paired male reproductive gland that produces sperm and that in most mammals is contained within the scrotum at sexual maturity. | Human, Chimpanzee, Bonobo, Gorilla, Gibbon, Macaque, Marmoset, Mouse, Opossum, Platypus, Chicken |
Cell Types
| Cell ontology | Maturity | Description | Species | Replicates | Cells per replicate |
|---|---|---|---|---|---|
| CL_0000020: spermatogonium | An euploid male germ cell of an early stage of spermatogenesis. | Human, Chimpanzee, Bonobo, Gorilla, Gibbon, Macaque, Marmoset, Mouse, Opossum, Platypus, Chicken | |||
| CL_0000017: spermatocyte | A male germ cell that develops from spermatogonia. The euploid primary spermatocytes undergo meiosis and give rise to the haploid secondary spermatocytes which in turn give rise to spermatids. | Human, Chimpanzee, Bonobo, Gorilla, Gibbon, Macaque, Marmoset, Mouse, Opossum, Platypus, Chicken | |||
| CL_0000018: spermatid | A male germ cell that develops from the haploid secondary spermatocytes. Without further division, spermatids undergo structural changes and give rise to spermatozoa. | Human, Chimpanzee, Bonobo, Gorilla, Gibbon, Macaque, Marmoset, Mouse, Opossum, Platypus, Chicken | |||
| CL_0000216: Sertoli cell | A supporting cell projecting inward from the basement membrane of seminiferous tubules. They surround and nourish the developing male germ cells and secrete androgen binding protein. Their tight junctions with the spermatogonia and spermatocytes provide a blood-testis barrier. | Human, Chimpanzee, Bonobo, Gorilla, Gibbon, Macaque, Marmoset, Mouse, Opossum, Platypus, Chicken | |||
| CL_0002371: somatic cell | A cell of an organism that does not pass on its genetic material to the organism's offspring (i.e. a non-germ line cell). | Human, Chimpanzee, Bonobo, Gorilla, Gibbon, Macaque, Marmoset, Mouse, Opossum, Platypus, Chicken |
Images
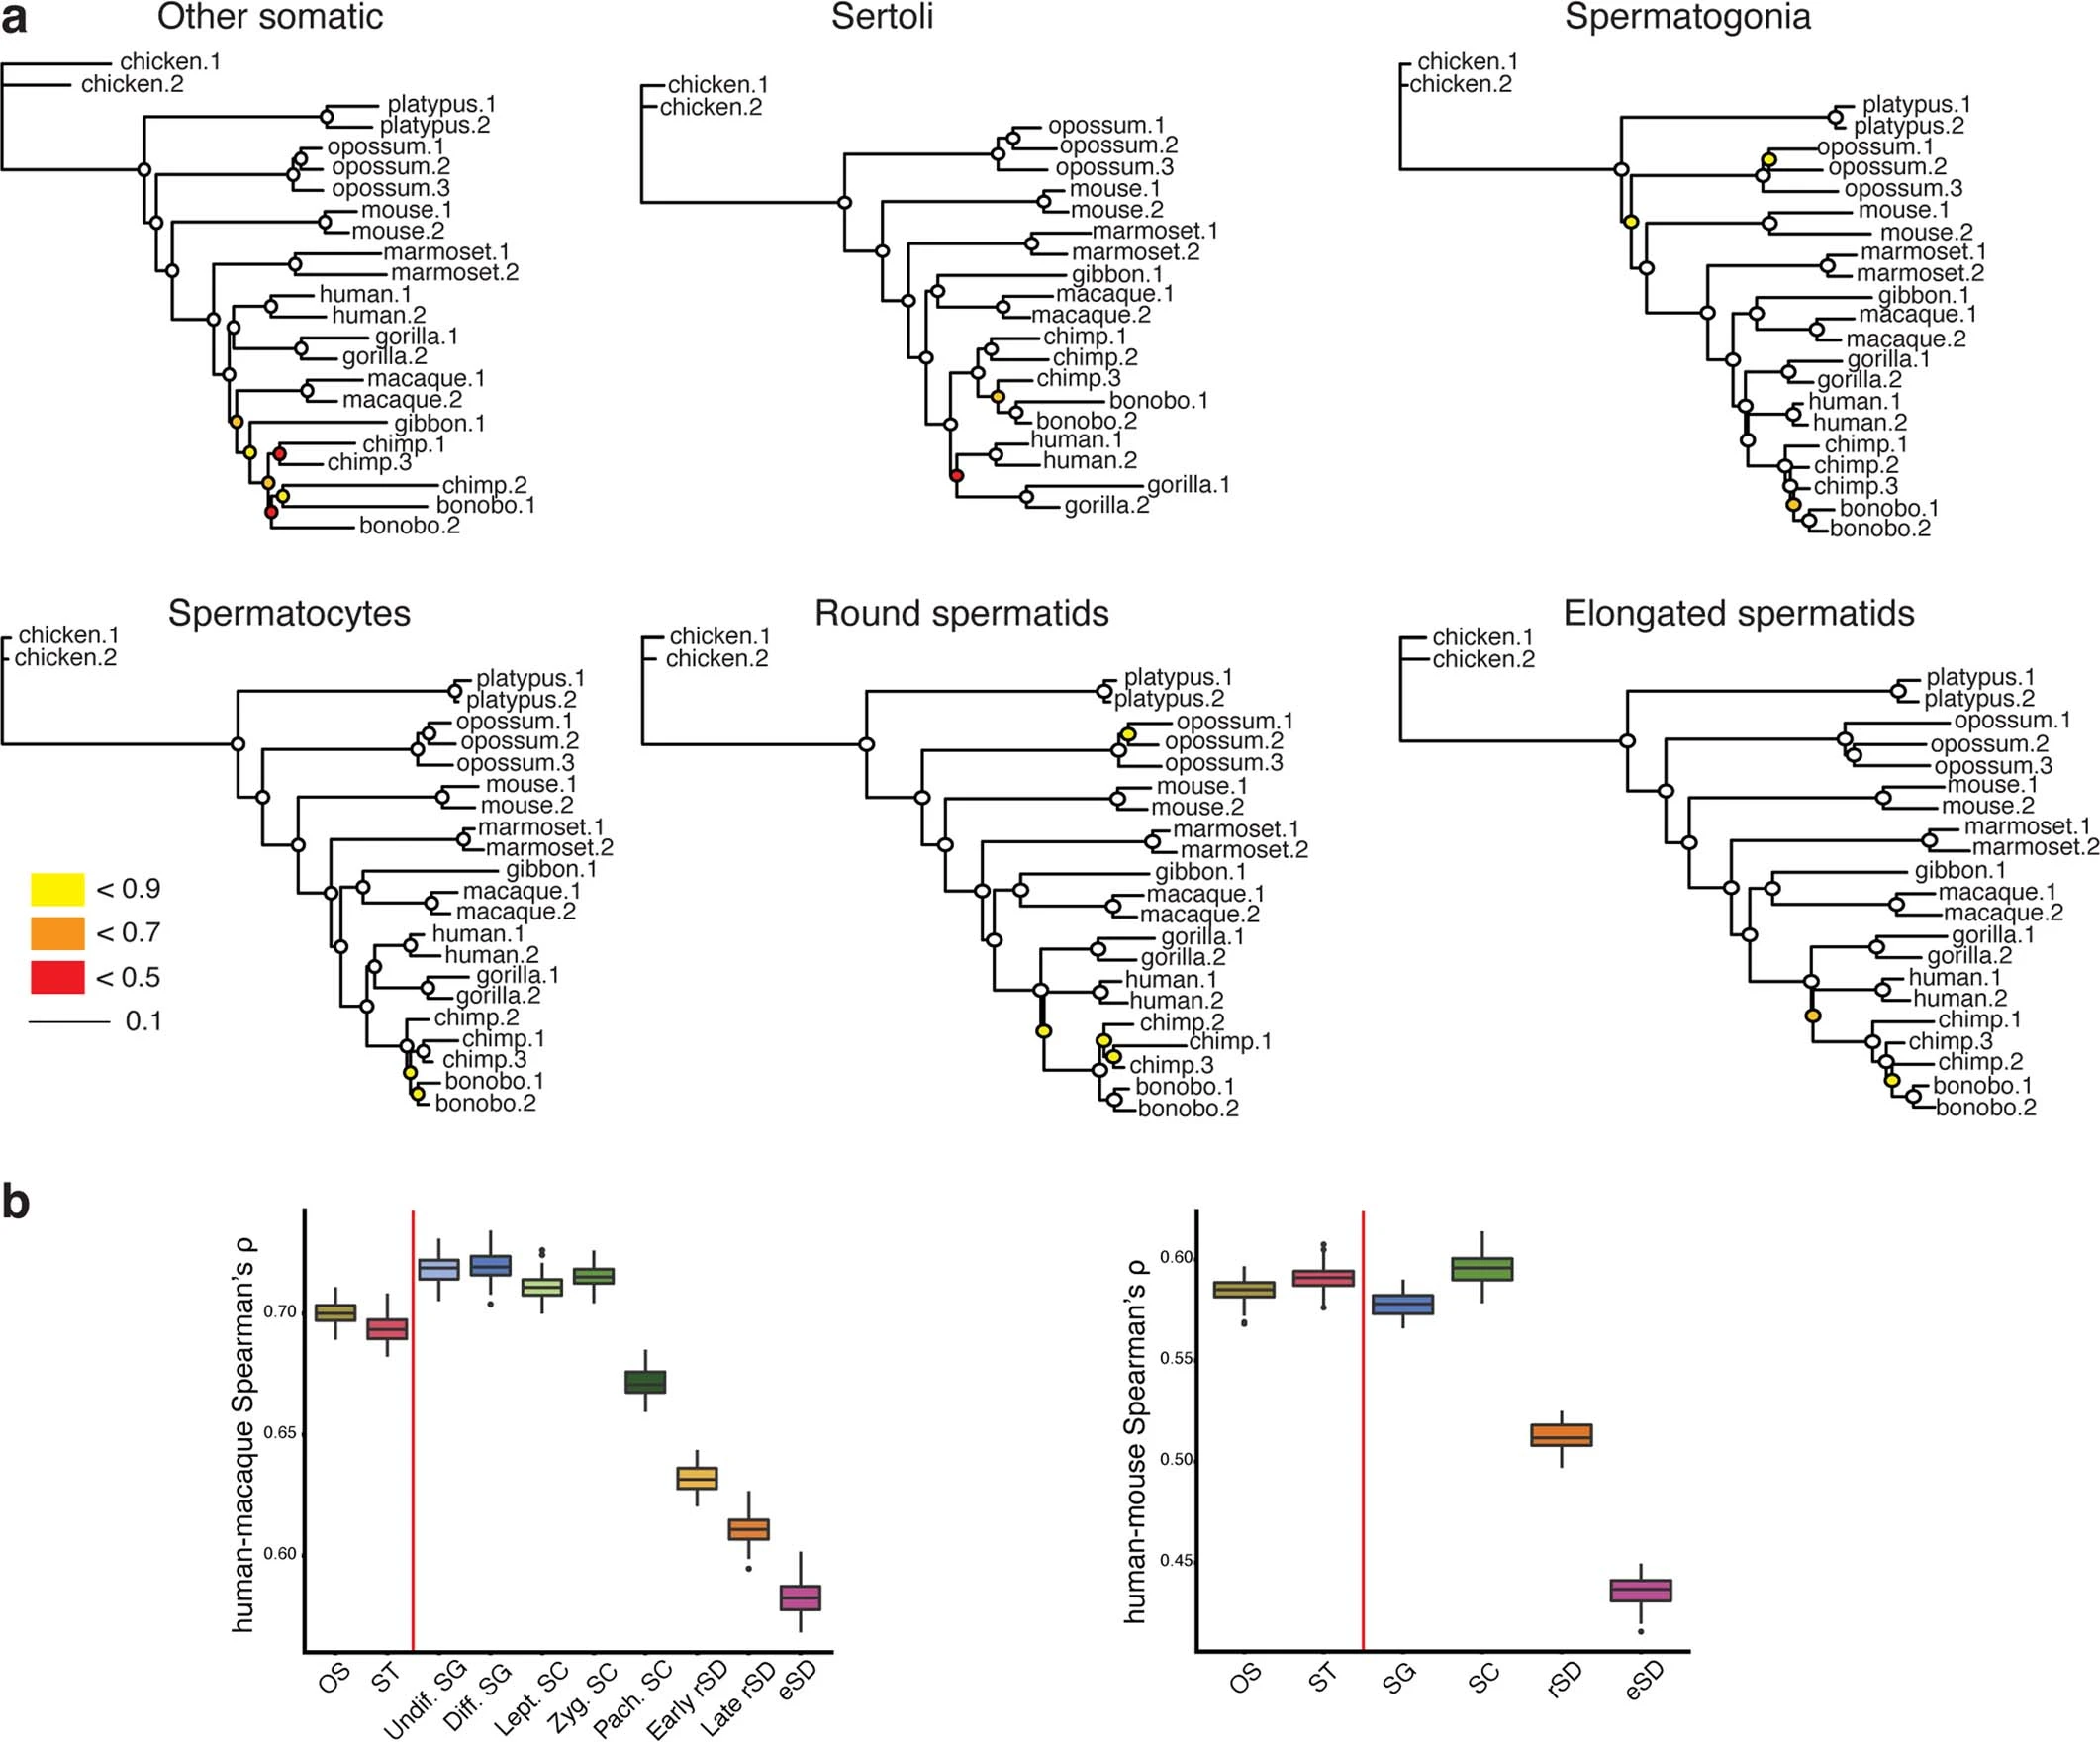
Figure 2: Mammalian testicular gene expression divergence
a, Gene expression phylogenies. Neighbor-joining trees based on pairwise expression level distances (1−rho, Spearman’s correlation coefficient) for the main testicular cell types, respectively (“Other somatic” refers to peritubular, smooth muscle, endothelial, macrophage, and Leydig cells as detailed in the legend of Extended Data Fig. 1 and Methods). Trees are drawn to the same scale (indicated by the scale bar). Bootstrap values (i.e., proportions of replicate trees that have the branching pattern as in the majority-rule consensus tree shown) are indicated by circles at the corresponding nodes: ≥ 0.9 (white fill). b, Human-macaque (left, n = 304) and human-mouse (right, n = 257) pairwise Spearman correlations after downsampling to the same number of nuclei and UMI across cell types for each species. Boxplots show the median (central value); upper and lower quartile (box limits) and 95% confidence intervals (whiskers) for 100 bootstrap replicates.
Licensed under: http://creativecommons.org/licenses/by/4.0/
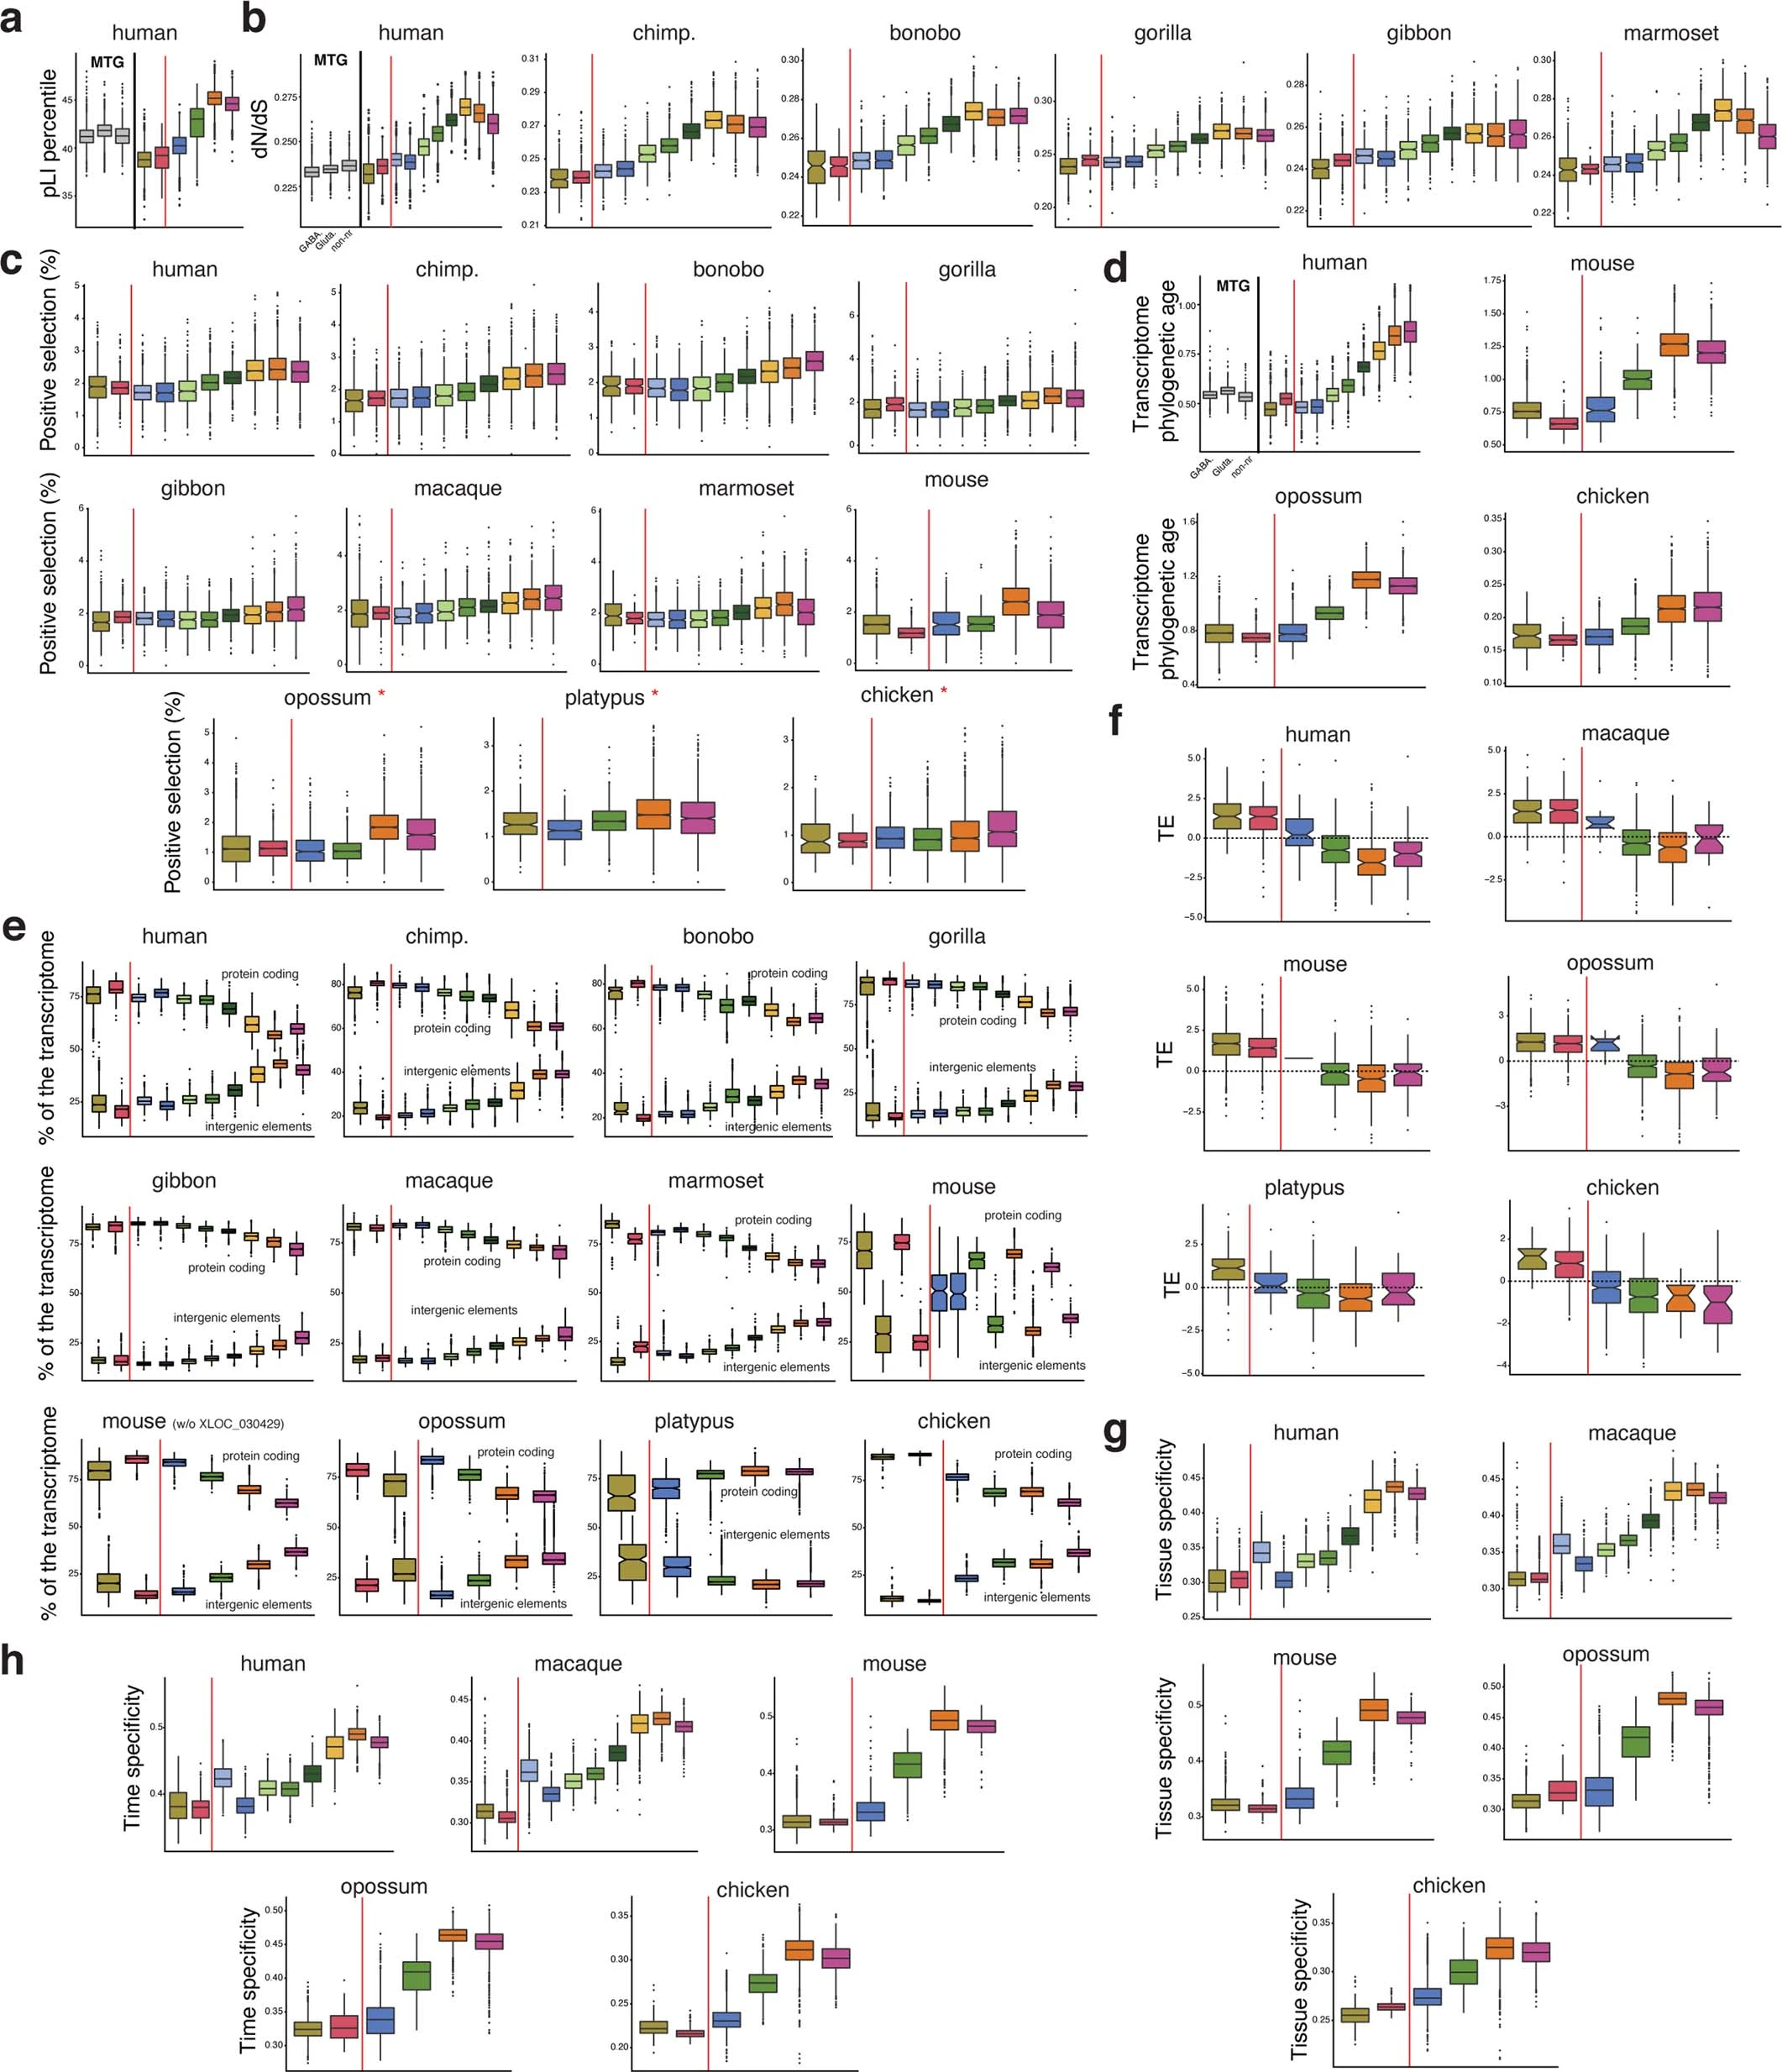
Figure 3: Evolutionary forces
a, Tolerance to functional variants. b, Average normalized ratio of nonsynonymous over synonymous nucleotide substitutions (dN/dS) of expressed genes across primates. c, Percentage of positively selected genes along spermatogenesis. Opossum, platypus, and chicken were not used in the original studies and so the 1:1 orthologues in these species were used. d, Phylogenetic age of cellular transcriptomes. Higher values reflect increased lineage-specific gene contributions (that is, younger transcriptomes). e, Percentages of UMIs that map to protein coding genes (top) or to intergenic elements (bottom). XLOC_030429 drives a different mouse pattern. f, Translational efficiency (TE; normalized log2-transformed values) of expressed genes. g, Tissue specificity. h, Time specificity (development). In a, b, and d, human middle temporal gyrus (MTG) snRNA-seq data84 was used for non-gonadal (brain) comparisons. Plotted is the mean value per cell. Superimposed thick black dots indicate medians from biological replicates. Box plots depict the median (centre value); upper and lower quartile (box limits) with whiskers at 1.5 times the interquartile range. Red lines separate somatic (OS, other somatic; ST, Sertoli cells) and germ cells.
Licensed under: http://creativecommons.org/licenses/by/4.0/
Data set 3: Evolution of gene expression trajectories along spermatogenesis
Transcriptome: Single-nucleus RNA Sequencing
Species
| Species |
|---|
| Human, Chimpanzee, Bonobo, Gorilla, Gibbon, Macaque, Marmoset, Mouse, Opossum, Platypus, Chicken |
Tissue Types
| BRENDA tissue ontology | Maturity | Description | Species | Replicates |
|---|---|---|---|---|
| BTO_0001363: testis | Adult | A typically paired male reproductive gland that produces sperm and that in most mammals is contained within the scrotum at sexual maturity. | Human, Chimpanzee, Bonobo, Gorilla, Gibbon, Macaque, Marmoset, Mouse, Opossum, Platypus, Chicken |
Cell Types
| Cell ontology | Maturity | Description | Species | Replicates | Cells per replicate |
|---|---|---|---|---|---|
| CL_0000020: spermatogonium | An euploid male germ cell of an early stage of spermatogenesis. | Human, Chimpanzee, Bonobo, Gorilla, Gibbon, Macaque, Marmoset, Mouse, Opossum, Platypus, Chicken | |||
| CL_0000017: spermatocyte | A male germ cell that develops from spermatogonia. The euploid primary spermatocytes undergo meiosis and give rise to the haploid secondary spermatocytes which in turn give rise to spermatids. | Human, Chimpanzee, Bonobo, Gorilla, Gibbon, Macaque, Marmoset, Mouse, Opossum, Platypus, Chicken | |||
| CL_0000018: spermatid | A male germ cell that develops from the haploid secondary spermatocytes. Without further division, spermatids undergo structural changes and give rise to spermatozoa. | Human, Chimpanzee, Bonobo, Gorilla, Gibbon, Macaque, Marmoset, Mouse, Opossum, Platypus, Chicken |
Images
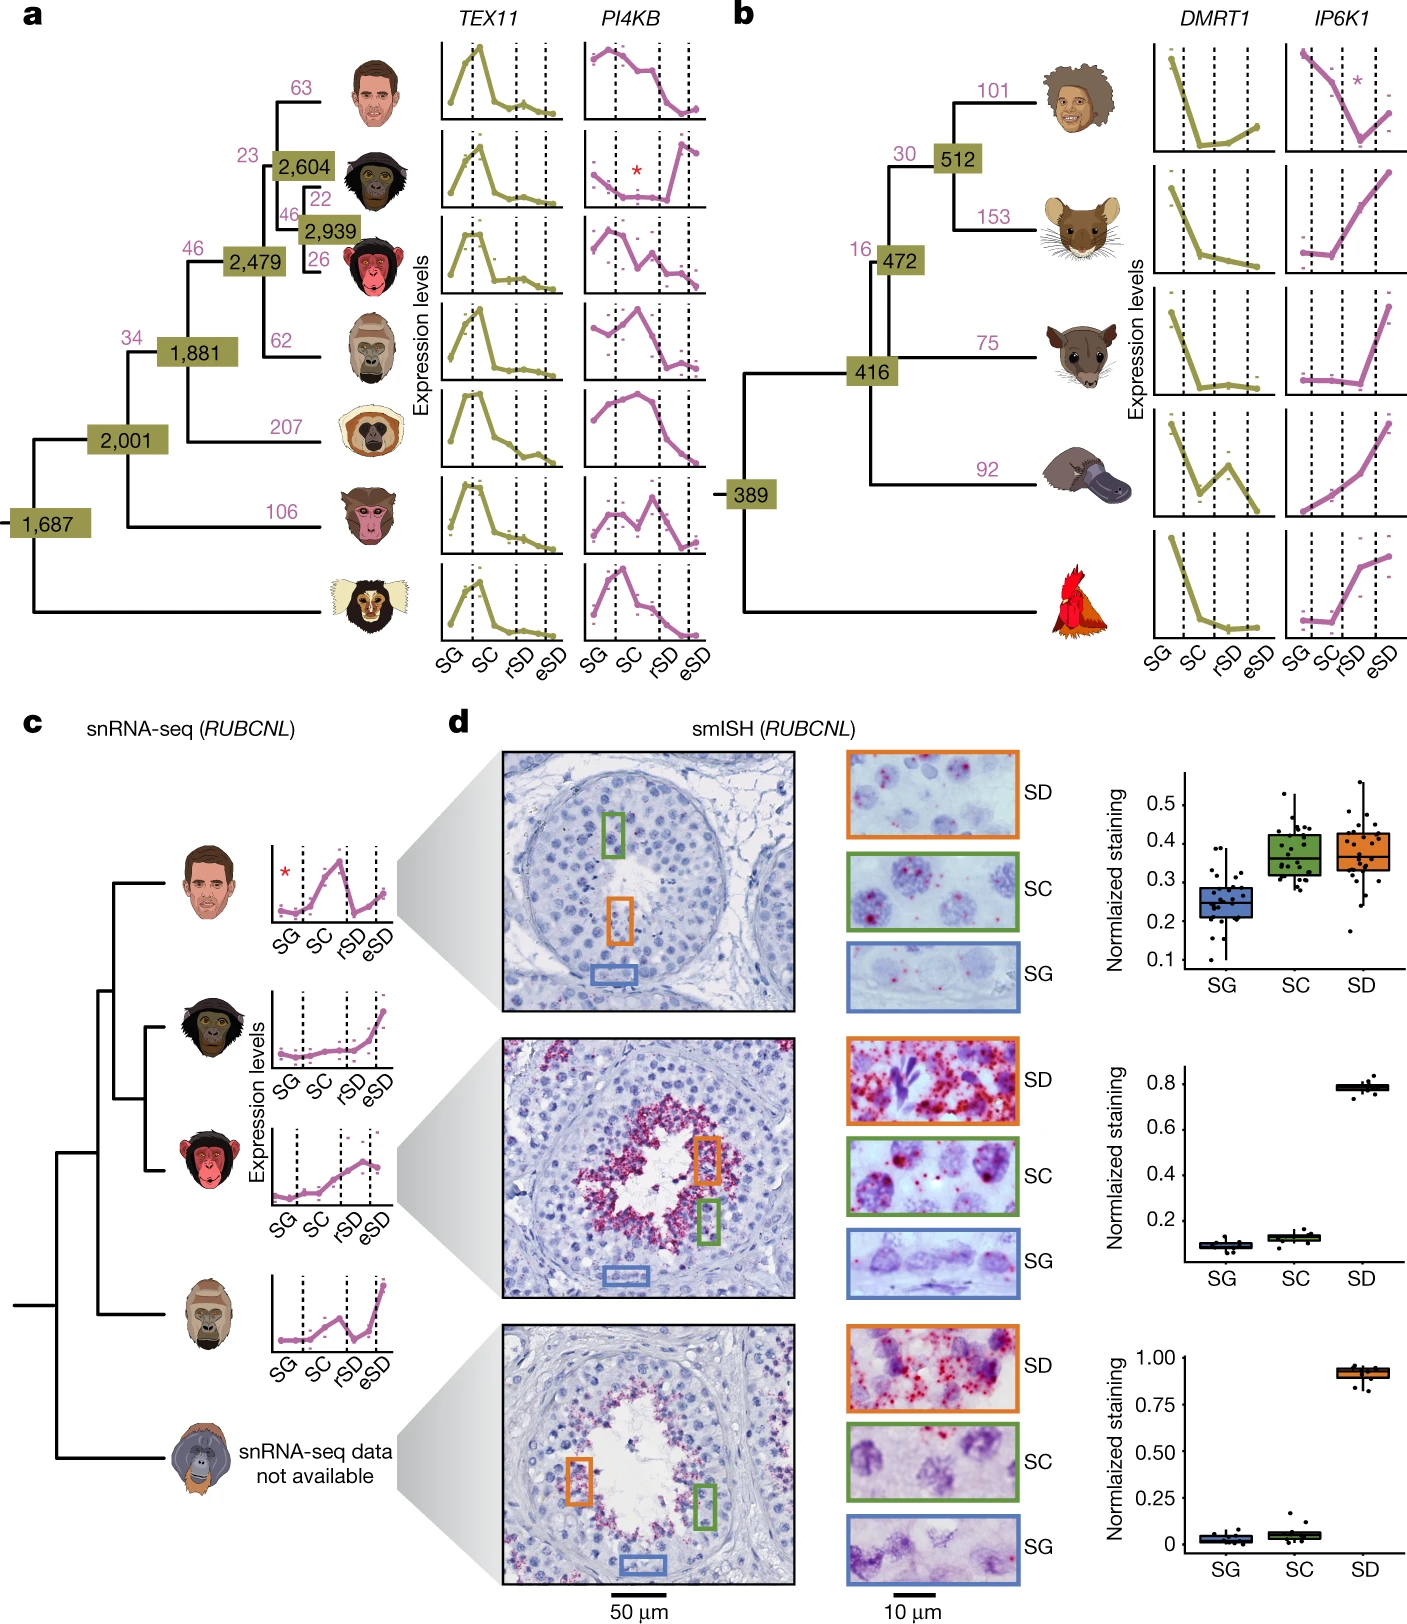
Figure 4: Evolution of gene expression trajectories along spermatogenesis
a,b, The numbers of changed trajectories (in purple) and conserved trajectories (in olive) are indicated. In a–c, red asterisks indicate the branch for which a trajectory change has been called. For each replicate, mean expression levels across cells of a given cell type were calculated. Marks indicate values for the replicates with the highest and lowest mean expression levels, dots indicate the median of mean expression values of the replicates (three replicates for chimpanzee and opossum; two for human, bonobo, gorilla, macaque, marmoset, mouse, platypus and chicken; one for gibbon). In a–c, dashed vertical lines separate SG, SCs, rSD and eSD. a, Primate trajectories (human, bonobo, chimpanzee, gorilla, gibbon, macaque and marmoset; from top to bottom) based on 4,459 1:1 orthologues. TEX11 and PI4KB are examples of conserved and changed trajectories, respectively. b, Amniote trajectories (human, mouse, opossum, platypus and chicken; from top to bottom) based on 2,927 1:1 orthologues. DMRT1 and IP6K1 are examples of conserved and changed trajectories, respectively. c, RUBCNL expression trajectory from snRNA-seq data along spermatogenesis for human, bonobo, chimpanzee and gorilla (from top to bottom). Available orangutan samples did not allow for the generation of high-quality snRNA-seq data. d, Detection of RUBCNL (each red dot reflects a single transcript) expression in human, chimpanzee and orangutan testis by smISH using RNAScope. Left, seminiferous tubule cross sections counterstained with haematoxylin, and closeups on areas containing SG, SC and spermatids (SD). Right, quantification of RUBCNL expression levels in ten tubules per section (n = 3 for human, n = 1 for chimpanzee and orangutan). Box plots represent the mean (central value) distribution of staining (dots); upper and lower quartile (box limits) with whiskers at 1.5 times the interquartile range.
Licensed under: http://creativecommons.org/licenses/by/4.0/
Data set 4: Contribution of new genes to the evolution of new spermatogenic functions
Transcriptome: Single-nucleus RNA Sequencing
Species
| Species |
|---|
| Human, Chimpanzee, Bonobo, Gorilla, Gibbon, Macaque, Marmoset, Mouse, Opossum, Platypus, Chicken |
Tissue Types
| BRENDA tissue ontology | Maturity | Description | Species | Replicates |
|---|---|---|---|---|
| BTO_0001363: testis | Adult | A typically paired male reproductive gland that produces sperm and that in most mammals is contained within the scrotum at sexual maturity. | Human, Chimpanzee, Bonobo, Gorilla, Gibbon, Macaque, Marmoset, Mouse, Opossum, Platypus, Chicken |
Cell Types
| Cell ontology | Maturity | Description | Species | Replicates | Cells per replicate |
|---|---|---|---|---|---|
| CL_0000020: spermatogonium | An euploid male germ cell of an early stage of spermatogenesis. | Human, Chimpanzee, Bonobo, Gorilla, Gibbon, Macaque, Marmoset, Mouse, Opossum, Platypus, Chicken | |||
| CL_0000017: spermatocyte | A male germ cell that develops from spermatogonia. The euploid primary spermatocytes undergo meiosis and give rise to the haploid secondary spermatocytes which in turn give rise to spermatids. | Human, Chimpanzee, Bonobo, Gorilla, Gibbon, Macaque, Marmoset, Mouse, Opossum, Platypus, Chicken | |||
| CL_0000018: spermatid | A male germ cell that develops from the haploid secondary spermatocytes. Without further division, spermatids undergo structural changes and give rise to spermatozoa. | Human, Chimpanzee, Bonobo, Gorilla, Gibbon, Macaque, Marmoset, Mouse, Opossum, Platypus, Chicken |
Images
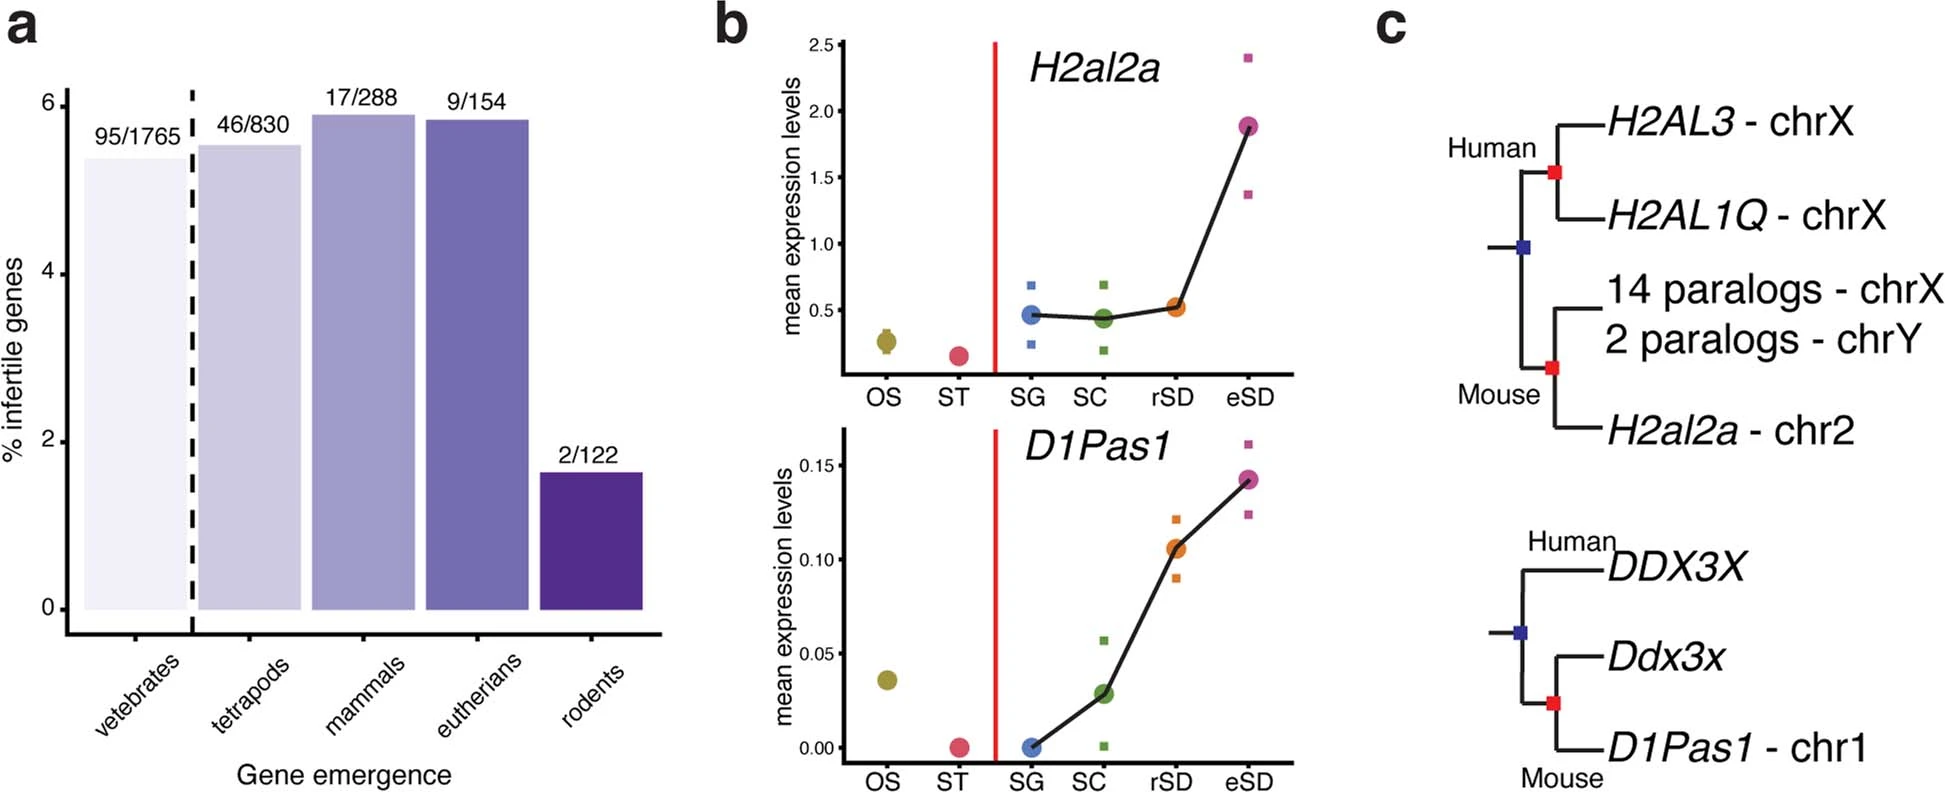
Figure 5: New genes with crucial spermatogenic functions
a, percentages of genes among new genes of different ages (i.e., emergence in last common vertebrate, tetrapod, mammalian, eutherian, or rodent ancestors) that show infertility phenotypes when knocked out in the mouse (numbers of genes with infertility phenotypes and total number of genes considered for an age category are provided above each bar). b, Expression level trajectories of the retrogenes H2al2a and D1Pas1 in spermatogenic and somatic cell types. For each of the two replicates, mean expression levels across cells of a given cell type were calculated. Marks indicate values for the replicates and dots indicate the median of the values of the replicates. c, Trees of H2al2a and D1Pas1 and paralogs from which they originated through the mechanism of RNA-based gene duplication (i.e., D1Pas1 stems from Ddx3y, whereas the precise ancestral parental gene of H2al2a is not easily discernable due to a complex history of a number of RNA- and DNA-based duplication events).
Licensed under: http://creativecommons.org/licenses/by/4.0/
Data set 5: Mammalian sex-chromosome evolution.
Transcriptome: Single-nucleus RNA Sequencing
Species
| Species |
|---|
| Human, Macaque, Mouse, Opossum, Platypus |
Tissue Types
| BRENDA tissue ontology | Maturity | Description | Species | Replicates |
|---|---|---|---|---|
| BTO_0001363: testis | Adult | A typically paired male reproductive gland that produces sperm and that in most mammals is contained within the scrotum at sexual maturity. | Human, Macaque, Mouse, Opossum, Platypus |
Cell Types
| Cell ontology | Maturity | Description | Species | Replicates | Cells per replicate |
|---|---|---|---|---|---|
| CL_0000020: spermatogonium | An euploid male germ cell of an early stage of spermatogenesis. | Human, Macaque, Mouse, Opossum, Platypus | |||
| CL_0000017: spermatocyte | A male germ cell that develops from spermatogonia. The euploid primary spermatocytes undergo meiosis and give rise to the haploid secondary spermatocytes which in turn give rise to spermatids. | Human, Macaque, Mouse, Opossum, Platypus | |||
| CL_0000018: spermatid | A male germ cell that develops from the haploid secondary spermatocytes. Without further division, spermatids undergo structural changes and give rise to spermatozoa. | Human, Macaque, Mouse, Opossum, Platypus | |||
| CL_0000216: Sertoli cell | A supporting cell projecting inward from the basement membrane of seminiferous tubules. They surround and nourish the developing male germ cells and secrete androgen binding protein. Their tight junctions with the spermatogonia and spermatocytes provide a blood-testis barrier. | Human, Macaque, Mouse, Opossum, Platypus | |||
| CL_0002371: somatic cell | A cell of an organism that does not pass on its genetic material to the organism's offspring (i.e. a non-germ line cell). | Human, Macaque, Mouse, Opossum, Platypus |
Images
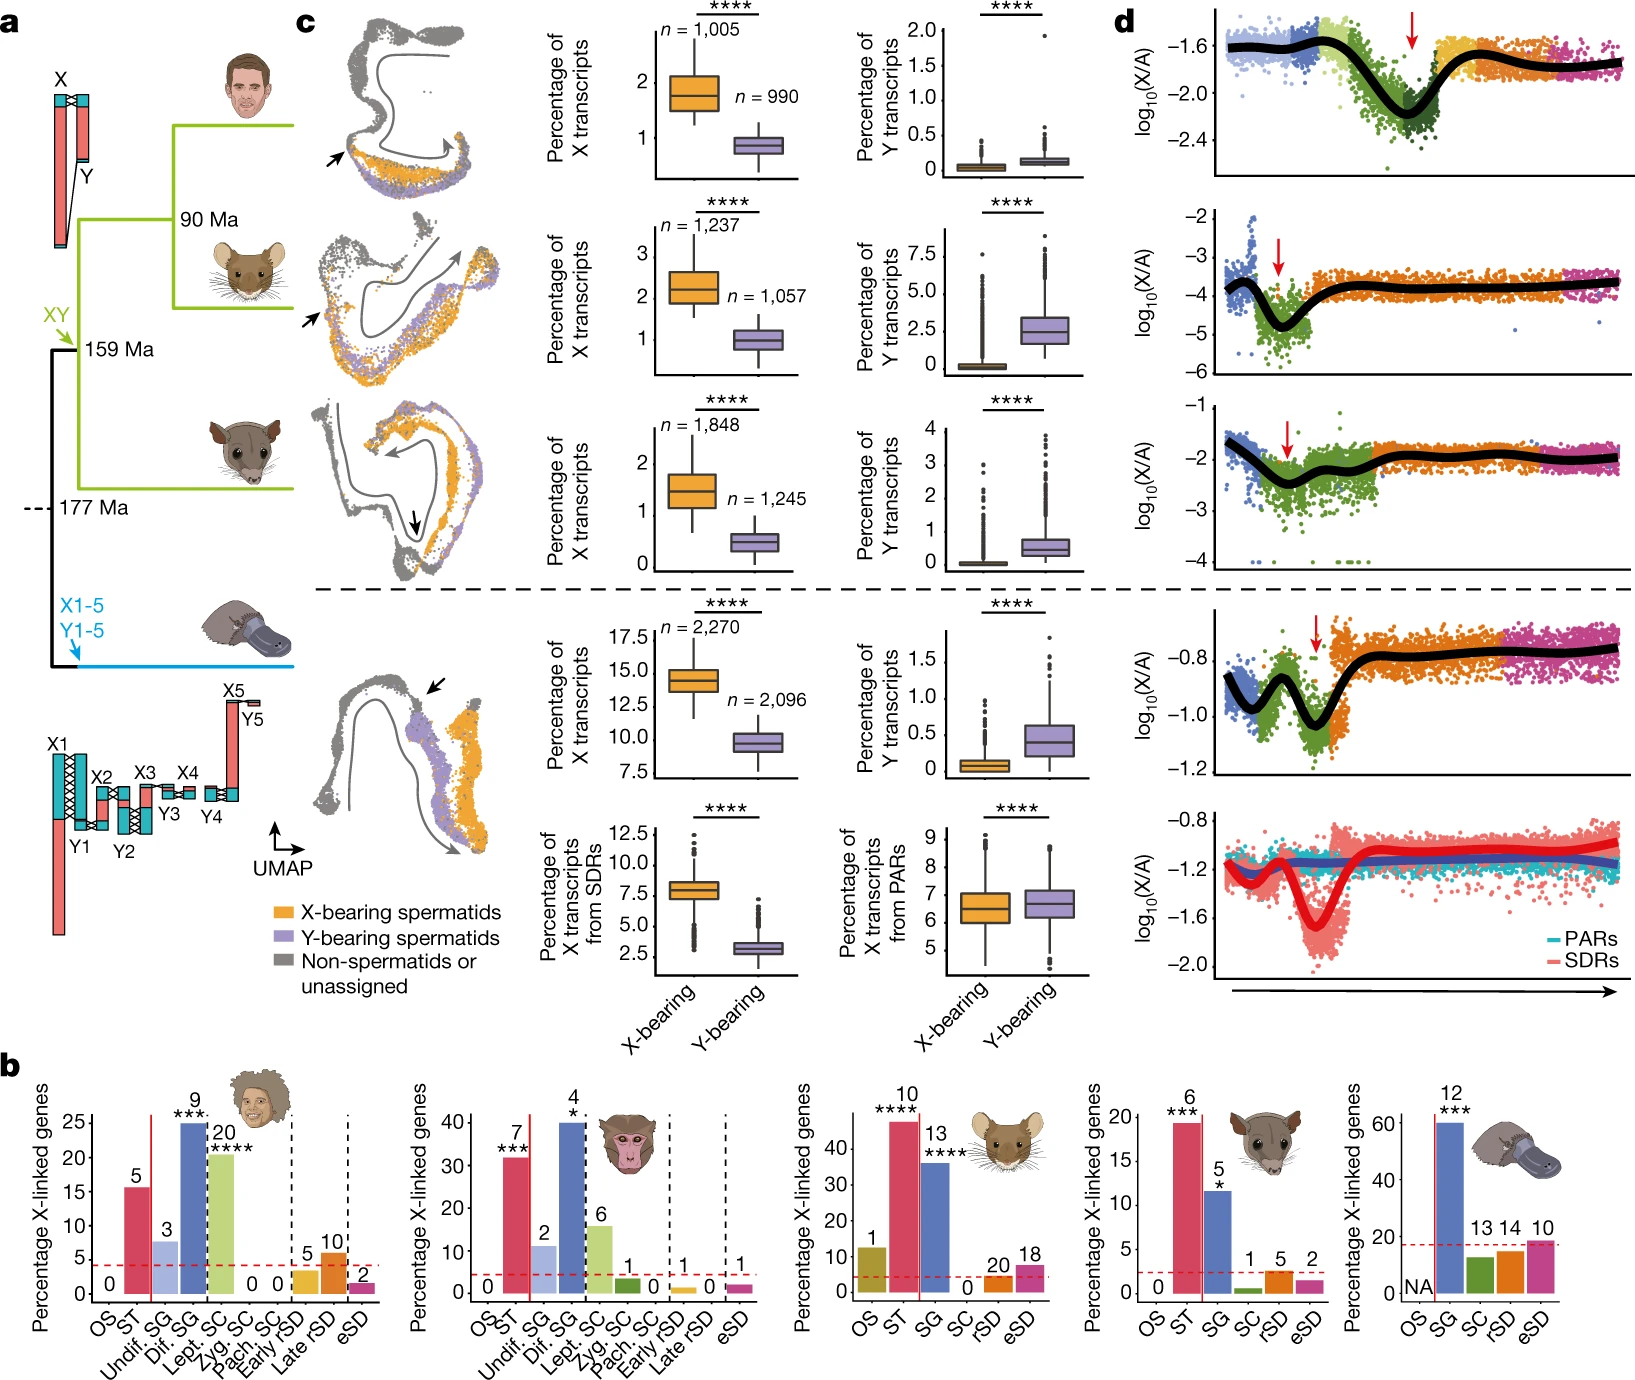
Figure 6: Mammalian sex-chromosome evolution
Phylogenetic tree for human, mouse, opossum and platypus (from top to bottom). Arrows show sex systems origination40. Illustration of therian (human, top) and monotreme (platypus, bottom) sex chromosomes. Recombining (crosses) PARs in turquoise and SDRs in red. b, Percentages of X-linked genes among testis-specific genes with predominant expression in a given cell type for human, macaque, mouse, opossum and platypus (from left to right; Supplementary Table 10). The red dashed line represents the expected percentages of X-linked genes, if testis-specific genes with predominant expression in the different cell types were randomly distributed across the genome. Asterisks indicate significance after two-sided exact binomial testing (Benjamini–Hochberg corrected P values from left to right: 0.000353, 1.18 × 10⁻⁷, 0.000687, 0.0142, 1.08 × 10⁻⁷, 3.45 × 10⁻⁸, 0.000792, 0.0355 and 0.00043). The number of testis-specific X-linked genes enriched in each cell type is indicated above each bar. c, UMAP representation of germ cells (left). Progression of spermatogenesis (grey arrow) and meiotic divisions (black arrows) are indicated. Spermatids identified as X- and Y-bearing are coloured in orange and purple, respectively. Box plots show the median (central value) percentages of X and Y transcripts in X- and Y-bearing spermatids; upper and lower quartile (box limits) with whiskers at 1.5 times the interquartile range. Two-sided Wilcoxon rank-sum tests were performed for statistical comparisons (Benjamini–Hochberg corrected ****P < 2.2 × 10⁻¹⁶). d, X-to-autosome transcript ratios in individual germ cells across spermatogenesis (from left to right). For spermatids, only X-bearing cells are considered. Lines depict generative additive model trend. Red arrows indicate MSCI. c,d, For platypus, X transcripts are dissected according to their location on the X chromosomes.
Licensed under: http://creativecommons.org/licenses/by/4.0/