Identification of 22 susceptibility loci associated with testicular germ cell tumors
Pluta J, Pyle LC, Nead KT, Wilf R, Li M, Mitra N, Weathers B, D'Andrea K, Almstrup K, Anson-Cartwright L, Benitez J, Brown CD, Chanock S, Chen C, Cortessis VK, Ferlin A, Foresta C, Gamulin M, Gietema JA, Grasso C, Greene MH, Grotmol T, Hamilton RJ, Haugen TB, Hauser R, Hildebrandt MAT, Johnson ME, Karlsson R, Kiemeney LA, Lessel D, Lothe RA, Loud JT, Loveday C, Martin-Gimeno P, Meijer C, Nsengimana J, Quinn DI, Rafnar T, Ramdas S, Richiardi L, Skotheim RI, Stefansson K, Turnbull C, Vaughn DJ, Wiklund F, Wu X, Yang D, Zheng T, Wells AD, Grant SFA, Rajpert-De Meyts E, Schwartz SM, Bishop DT, McGlynn KA, Kanetsky PA, Nathanson KL; Testicular Cancer Consortium., 23.07.2023
Abstract
Testicular germ cell tumors (TGCT) are the most common tumor in young white men and have a high heritability. In this study, the international Testicular Cancer Consortium assemble 10,156 and 179,683 men with and without TGCT, respectively, for a genome-wide association study. This meta-analysis identifies 22 TGCT susceptibility loci, bringing the total to 78, which account for 44% of disease heritability. Men with a polygenic risk score (PRS) in the 95th percentile have a 6.8-fold increased risk of TGCT compared to men with median scores. Among men with independent TGCT risk factors such as cryptorchidism, the PRS may guide screening decisions with the goal of reducing treatment-related complications causing long-term morbidity in survivors. These findings emphasize the interconnected nature of two known pathways that promote TGCT susceptibility: male germ cell development within its somatic niche and regulation of chromosomal division and structure, and implicate an additional biological pathway, mRNA translation.
Pluta J, Pyle LC, Nead KT, Wilf R, Li M, Mitra N, Weathers B, D'Andrea K, Almstrup K, Anson-Cartwright L, Benitez J, Brown CD, Chanock S, Chen C, Cortessis VK, Ferlin A, Foresta C, Gamulin M, Gietema JA, Grasso C, Greene MH, Grotmol T, Hamilton RJ, Haugen TB, Hauser R, Hildebrandt MAT, Johnson ME, Karlsson R, Kiemeney LA, Lessel D, Lothe RA, Loud JT, Loveday C, Martin-Gimeno P, Meijer C, Nsengimana J, Quinn DI, Rafnar T, Ramdas S, Richiardi L, Skotheim RI, Stefansson K, Turnbull C, Vaughn DJ, Wiklund F, Wu X, Yang D, Zheng T, Wells AD, Grant SFA, Rajpert-De Meyts E, Schwartz SM, Bishop DT, McGlynn KA, Kanetsky PA, Nathanson KL; Testicular Cancer Consortium. Identification of 22 susceptibility loci associated with testicular germ cell tumors. Nat Commun. 2021 Jul 23;12(1):4487. doi: 10.1038/s41467-021-24334-y. PMID: 34301922; PMCID: PMC8302763.
Publication: https://doi.org/10.1038/s41467-021-24334-y
 Disclaimer
The publication Identification of 22 susceptibility loci associated with testicular germ cell tumors by Pluta J, Pyle LC, Nead KT, Wilf R, Li M, Mitra N, Weathers B, D'Andrea K, Almstrup K, Anson-Cartwright L, Benitez J, Brown CD, Chanock S, Chen C, Cortessis VK, Ferlin A, Foresta C, Gamulin M, Gietema JA, Grasso C, Greene MH, Grotmol T, Hamilton RJ, Haugen TB, Hauser R, Hildebrandt MAT, Johnson ME, Karlsson R, Kiemeney LA, Lessel D, Lothe RA, Loud JT, Loveday C, Martin-Gimeno P, Meijer C, Nsengimana J, Quinn DI, Rafnar T, Ramdas S, Richiardi L, Skotheim RI, Stefansson K, Turnbull C, Vaughn DJ, Wiklund F, Wu X, Yang D, Zheng T, Wells AD, Grant SFA, Rajpert-De Meyts E, Schwartz SM, Bishop DT, McGlynn KA, Kanetsky PA, Nathanson KL; Testicular Cancer Consortium. is published under an open access license: http://creativecommons.org/licenses/by/4.0/. Permits non-commercial re-use, distribution, and reproduction in any medium, provided the original work is properly cited.
Curation by the MFGA team Relevant data sets presented in the publication have been identified. If possible, annotations (title, general information, conditions, processed tissue types and processed cell types) have been added based on information from the publication. Data tables and images that provide a good overview on the publication's findings on the data set have been extracted from the publication and/or supplement. If not stated otherwise, images are depicted with title and description exactly as in the publication. Tables have been adjusted to the MFGA table format. Conducted adjustments are explained in the detailed view of the tables. However, titles and descriptions have been adopted from the publication.
Data set 1: Novel independent TGCT susceptibility loci
Genome: Genotyping
Species
| Species |
|---|
| Human |
Images
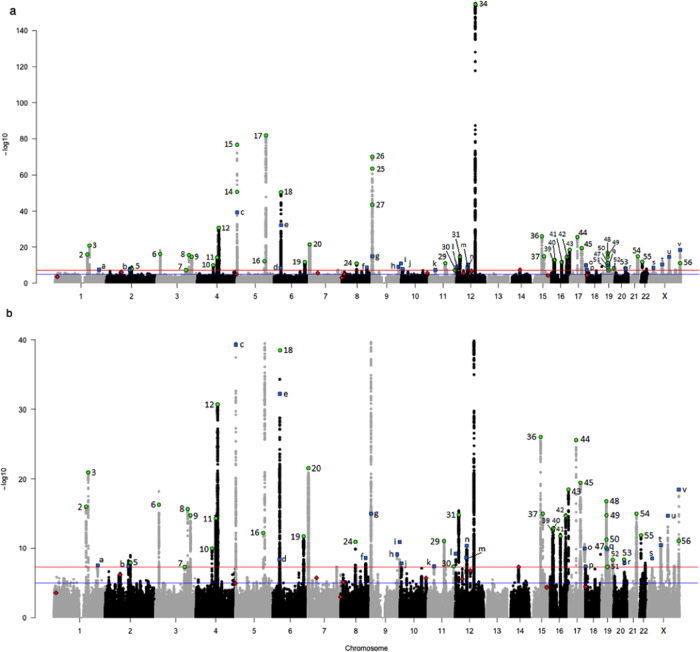
Figure 1: Manhattan plots of markers associated with TGCT risk
Novel markers identified in the current meta-analysis are shown as blue squares (An external file that holds a picture, illustration, etc. Object name is 41467_2021_24334_Figa_HTML.gif) with lowercase letters corresponding to column 1 of Table 1. Susceptibility markers identified in previous studies that surpassed genome-wide significance (P ≤ 1 × 10⁻⁸) in the current meta-analysis are shown as green circles (An external file that holds a picture, illustration, etc. Object name is 41467_2021_24334_Figb_HTML.gif) with numbers corresponding to column 1 of Supplementary Data 2. Susceptibility markers identified in previous studies that failed to attain genome-wide significance (P > 1 × 10⁻⁸) in the current meta-analysis are shown as red diamonds (An external file that holds a picture, illustration, etc. Object name is 41467_2021_24334_Figc_HTML.gif) with numbers corresponding to column 1 of Supplementary Data 2. a Markers are plotted against a full range y-axis that incorporates rs4474514 at KITLG (P = 1.42 × 10−154). b Markers are plotted against a partial range y-axis capped at P = 1.42 × 10−40 to allow for better visualization and discrimination of most associations.
Licensed under: http://creativecommons.org/licenses/by/4.0/
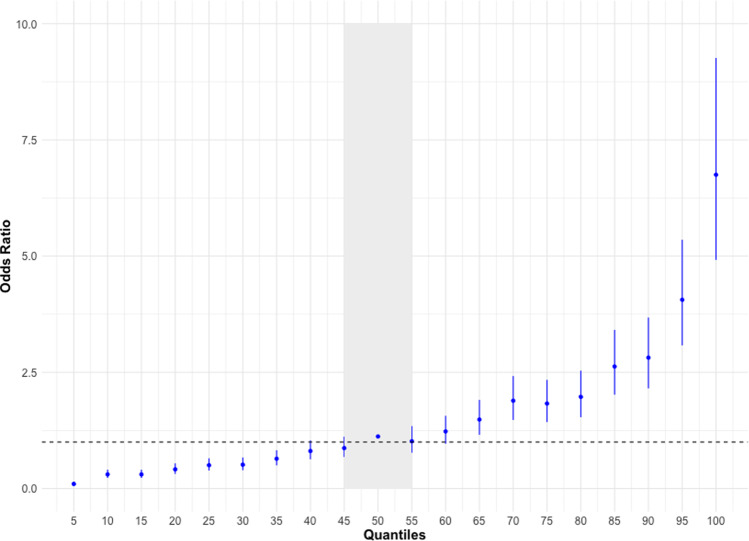
Figure 2: Association of polygenic risk score and TGCT status
Polygenic risk scores (PRS) were calculated for independent samples from n = 5602 men with TGCT and 5006 men without disease from a model incorporating the 22 novel and 56 previously identified markers and effect size estimates from the meta-analysis. Odds ratios are relative to the median risk, composed of subjects in 45–55th percentile of PRS. Men in the top 95th percentile had a 6.8-fold increase (odds ratio (OR) = 6.75, 95% confidence interval (CI) 4.92–9.26; P = 2.84 × 10⁻³²) in risk of developing TGCT compared to men at the 45–55th percentile. Dashed line indicates OR = 1; error bars represent 95% CI.
Licensed under: http://creativecommons.org/licenses/by/4.0/
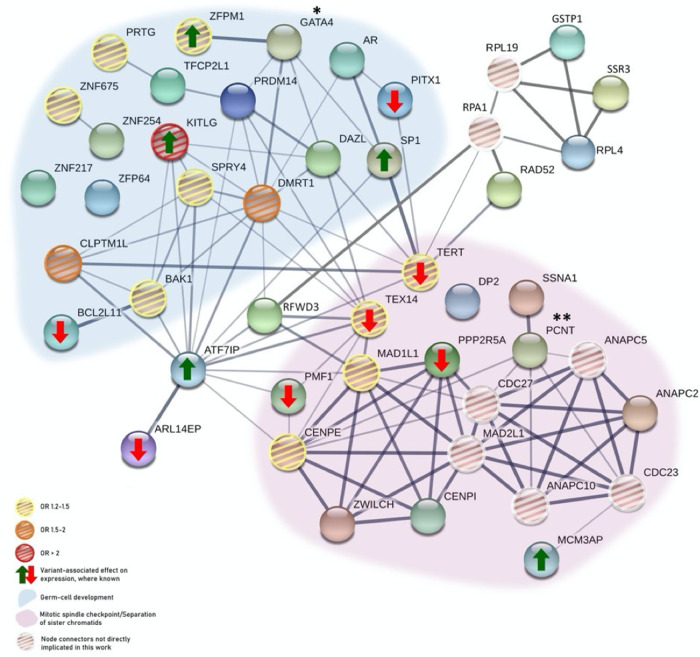
Figure 3: Interaction of proteins in the germ cell development and chromosomal segregation pathways
A protein–protein interaction network for the germ cell development and chromosomal segregation pathways was created using STRING (string-db.org). Proteins encoded by genes implicated as associated with TGCT susceptibility in these pathways are shown, and line weights indicates the degree of confidence of interaction between any two proteins. *GATA4, a previously identified TGCT susceptibility locus, did not reach genome-wide statistical significance in our current study. **PCNT was evaluated as a low likelihood target gene.
Licensed under: http://creativecommons.org/licenses/by/4.0/