Integrated Molecular Characterization of Testicular Germ Cell Tumors
Shen H, Shih J, Hollern DP, Wang L, Bowlby R, Tickoo SK, Thorsson V, Mungall AJ, Newton Y, Hegde AM, Armenia J, Sánchez-Vega F, Pluta J, Pyle LC, Mehra R, Reuter VE, Godoy G, Jones J, Shelley CS, Feldman DR, Vidal DO, Lessel D, Kulis T, Cárcano FM, Leraas KM, Lichtenberg TM, Brooks D, Cherniack AD, Cho J, Heiman DI, Kasaian K, Liu M, Noble MS, Xi L, Zhang H, Zhou W, ZenKlusen JC, Hutter CM, Felau I, Zhang J, Schultz N, Getz G, Meyerson M, Stuart JM; Cancer Genome Atlas Research Network; Akbani R, Wheeler DA, Laird PW, Nathanson KL, Cortessis VK, Hoadley KA, 12.06.2018
Abstract
We studied 137 primary testicular germ cell tumors (TGCTs) using high-dimensional assays of genomic, epigenomic, transcriptomic, and proteomic features. These tumors exhibited high aneuploidy and a paucity of somatic mutations. Somatic mutation of only three genes achieved significance-KIT, KRAS, and NRAS-exclusively in samples with seminoma components. Integrated analyses identified distinct molecular patterns that characterized the major recognized histologic subtypes of TGCT: seminoma, embryonal carcinoma, yolk sac tumor, and teratoma. Striking differences in global DNA methylation and microRNA expression between histology subtypes highlight a likely role of epigenomic processes in determining histologic fates in TGCTs. We also identified a subset of pure seminomas defined by KIT mutations, increased immune infiltration, globally demethylated DNA, and decreased KRAS copy number. We report potential biomarkers for risk stratification, such as miRNA specifically expressed in teratoma, and others with molecular diagnostic potential, such as CpH (CpA/CpC/CpT) methylation identifying embryonal carcinomas.
Shen H, Shih J, Hollern DP, Wang L, Bowlby R, Tickoo SK, Thorsson V, Mungall AJ, Newton Y, Hegde AM, Armenia J, Sánchez-Vega F, Pluta J, Pyle LC, Mehra R, Reuter VE, Godoy G, Jones J, Shelley CS, Feldman DR, Vidal DO, Lessel D, Kulis T, Cárcano FM, Leraas KM, Lichtenberg TM, Brooks D, Cherniack AD, Cho J, Heiman DI, Kasaian K, Liu M, Noble MS, Xi L, Zhang H, Zhou W, ZenKlusen JC, Hutter CM, Felau I, Zhang J, Schultz N, Getz G, Meyerson M, Stuart JM; Cancer Genome Atlas Research Network; Akbani R, Wheeler DA, Laird PW, Nathanson KL, Cortessis VK, Hoadley KA. Integrated Molecular Characterization of Testicular Germ Cell Tumors. Cell Rep. 2018 Jun 12;23(11):3392-3406. doi: 10.1016/j.celrep.2018.05.039. PMID: 29898407; PMCID: PMC6075738.
Publication: https://doi.org/10.1016/j.celrep.2018.05.039
 Disclaimer
The publication Integrated Molecular Characterization of Testicular Germ Cell Tumors by Shen H, Shih J, Hollern DP, Wang L, Bowlby R, Tickoo SK, Thorsson V, Mungall AJ, Newton Y, Hegde AM, Armenia J, Sánchez-Vega F, Pluta J, Pyle LC, Mehra R, Reuter VE, Godoy G, Jones J, Shelley CS, Feldman DR, Vidal DO, Lessel D, Kulis T, Cárcano FM, Leraas KM, Lichtenberg TM, Brooks D, Cherniack AD, Cho J, Heiman DI, Kasaian K, Liu M, Noble MS, Xi L, Zhang H, Zhou W, ZenKlusen JC, Hutter CM, Felau I, Zhang J, Schultz N, Getz G, Meyerson M, Stuart JM; Cancer Genome Atlas Research Network; Akbani R, Wheeler DA, Laird PW, Nathanson KL, Cortessis VK, Hoadley KA is published under an open access license: https://creativecommons.org/licenses/by/4.0/. Permits non-commercial re-use, distribution, and reproduction in any medium, provided the original work is properly cited.
Curation by the MFGA team Relevant data sets presented in the publication have been identified. If possible, annotations (title, general information, conditions, processed tissue types and processed cell types) have been added based on information from the publication. Data tables and images that provide a good overview on the publication's findings on the data set have been extracted from the publication and/or supplement. If not stated otherwise, images are depicted with title and description exactly as in the publication. Tables have been adjusted to the MFGA table format. Conducted adjustments are explained in the detailed view of the tables. However, titles and descriptions have been adopted from the publication.
Data set 1: Molecular alterations and features across 137 TGCT samples
Exome: Whole Exome Sequencing
Species
| Species |
|---|
| Human |
Tissue Types
| BRENDA tissue ontology | Maturity | Description | Species | Replicates |
|---|---|---|---|---|
| BTO_0001363: testis | A typically paired male reproductive gland that produces sperm and that in most mammals is contained within the scrotum at sexual maturity. | Human | 137 |
Cell Types
| Cell ontology | Maturity | Description | Species | Replicates | Cells per replicate |
|---|---|---|---|---|---|
| CL_0000586: germ cell | seminoma | The reproductive cell in multicellular organisms. | Human | 72 | |
| CL_0000586: germ cell | embryonal carcinoma | The reproductive cell in multicellular organisms. | Human | 18 | |
| CL_0000586: germ cell | embryonal carcinoma dominant | The reproductive cell in multicellular organisms. | Human | 9 | |
| CL_0000586: germ cell | mature teratoma | The reproductive cell in multicellular organisms. | Human | 3 | |
| CL_0000586: germ cell | mature teratoma dominant | The reproductive cell in multicellular organisms. | Human | 10 | |
| CL_0000586: germ cell | immature teratoma dominant | The reproductive cell in multicellular organisms. | Human | 3 | |
| CL_0000586: germ cell | yolk sac tumor | The reproductive cell in multicellular organisms. | Human | 5 | |
| CL_0000586: germ cell | yolk sac tumor dominant | The reproductive cell in multicellular organisms. | Human | 8 | |
| CL_0000586: germ cell | mixed tumors with no dominant component | The reproductive cell in multicellular organisms. | Human | 9 |
Images
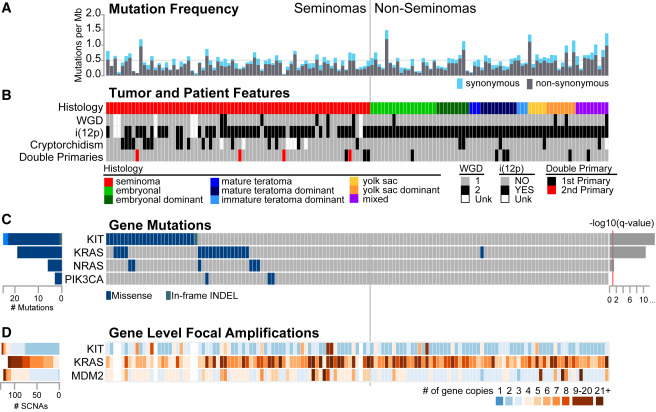
Figure 1: Molecular Alterations and Features across 137 TGCT Samples
(A) Somatic mutation frequency (mutations/Mb) from exome sequencing. The horizontal gray dashed line marks the median mutation rate of 0.5 mutations/Mb. The vertical gray line divides pure seminomas from NSGCTs. (B) Tumor and patient features per sample. Whole genome doubling (WGD) and i(12p) status are using the ABSOLUTE algorithm. Calls for WGD or inferred i(12p) status could not be made for six low-purity samples. Cryptorchidism status, family history of testicular germ cell tumor (TGCT) or other cancer, and presence of double primaries are displayed. Unk, unknown. (C) Significant recurrent mutations (KIT, KRAS, and NRAS) or curated based on frequency or biological relevance. (D) Three known oncogenes were significantly focally amplified. Values represent the number of gene copies detected using the ABSOLUTE integer copy number.
Licensed under: https://creativecommons.org/licenses/by/4.0/
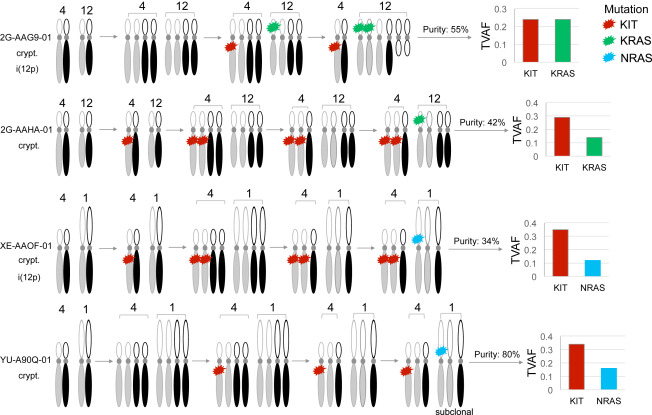
Figure 2: Inferred Order of Somatic Mutations and DNA Copy Number Alterations in TGCTs
Four seminomas with co-existing somatic mutations in KIT, KRAS, and NRAS were selected. The timing of somatic events within each sample was inferred by integrated analysis of mutation multiplicity, allelic integer copy number, and whole-genome doubling status. Mutation multiplicity (sq) was calculated from purity, total copy number (CN), and tumor variant allele fraction (TVAF) as follows: sq = TVAF[(CN∗purity)+(2∗(1−purity))]/purity. Integer copy number, whole-genome doubling status, and purity of tumor genomes were calculated using the ABSOLUTE algorithm. Cryptorchidism (crypt), isochromosome 12p [i(12p)]. Gray and black identify homologous chromosomes.
Licensed under: https://creativecommons.org/licenses/by/4.0/
Data set 2: DNA methylation differences between TGCT histology types
Methylome: Bisulfite Genomic Sequencing
Species
| Species |
|---|
| Human |
Tissue Types
| BRENDA tissue ontology | Maturity | Description | Species | Replicates |
|---|---|---|---|---|
| BTO_0001363: testis | A typically paired male reproductive gland that produces sperm and that in most mammals is contained within the scrotum at sexual maturity. | Human |
Cell Types
| Cell ontology | Maturity | Description | Species | Replicates | Cells per replicate |
|---|---|---|---|---|---|
| CL_0000670: primordial germ cell | A primordial germ cell is a diploid germ cell precursors that transiently exist in the embryo before they enter into close association with the somatic cells of the gonad and become irreversibly committed as germ cells. | Human | |||
| CL_0000542: lymphocyte | A lymphocyte is a leukocyte commonly found in the blood and lymph that has the characteristics of a large nucleus, a neutral staining cytoplasm, and prominent heterochromatin. | Human |
Images
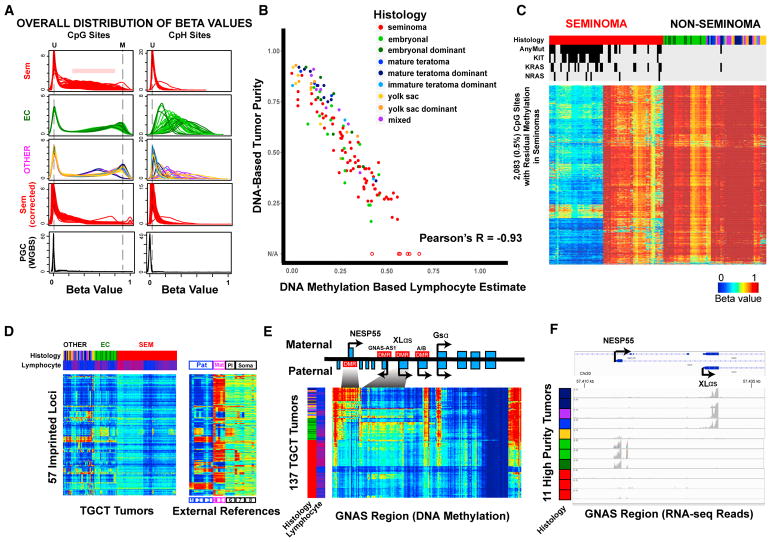
Figure 3: Dramatic DNA Methylation Differences Observed between TGCT Histology Types
(A) Smoothed density plots show overall distributions of beta values at CpG (left) and CpH sites (right) grouped by seminoma, EC and EC dominant, and other (OTHER) tumors. Vertical dashed lines indicate locations corresponding to unmethylated (U) and methylated (M) sites. Four primordial germ cell (PGC) samples from external whole-genome bisulfite sequencing (WGBS) studies are plotted for the same sites included on the HM450 arrays. (B) Overall correlation between the DNA methylation signature-based lymphocyte estimates (x axis) versus mutation and SNP array-based (ABSOLUTE) tumor purity estimates (y axis) for 131 tumors. Six additional tumors without ABSOLUTE estimates as a result of extremely low purity are plotted with hollow circles. (C) DNA methylation at 2,083 (0.5%) loci (rows) with residual methylation in seminomas (columns) differs based on KIT/RAS mutation status. Data are corrected for lymphocyte infiltration (uncorrected data shown in Figure S1D). Blue to red indicates 0% to 100% methylation. Top color bars annotate the histology of each tumor and mutation status in KIT/KRAS/NRAS (black, mutants; gray, wild-type). (D) DNA methylation patterns at 57 imprinted loci. Inferred lymphocyte fraction is included as the second column color bar (blue to red: low to high level of contamination). External reference data (right) are plotted for the same set of loci representing paternal (Pat; 1, sperm; 2, hydatidiform mole; 3, paternal Unipaternal Disomy [pUPD] leukocyte), maternal (Mat; 4, maternal Unipaternal Disomy [mUPD] leukocyte; 5, parthenogenetically derived oocytes), and placental (Pl; 6, placenta)-imprinting patterns, in addition to ESCs (7, ESCs from 2, oocyte) and somatic tissues (8, somatic tissues). (E) The GNAS complex locus demonstrates contrasting DNA methylation patterns in different subtypes. Seminomas show an overall lack of methylation (observed methylation explainable by lymphocytic infiltration); EC and EC-dominant tumors show extensive methylation at the paternal DMR at the NESP55 promoter, and other tumors tend to have methylation at the maternal DMR near the XLαs promoter. (F) RNA-seq reads for different GNAS transcripts are consistent with DNA methylation patterns. Eleven tumors with relatively high purity of different histologies are shown.
Licensed under: https://creativecommons.org/licenses/by/4.0/
Data set 3: Immune signatures are high in seminomas
Transcriptome: RNA-Sequencing
Species
| Species |
|---|
| Human |
Tissue Types
| BRENDA tissue ontology | Maturity | Description | Species | Replicates |
|---|---|---|---|---|
| BTO_0001363: testis | A typically paired male reproductive gland that produces sperm and that in most mammals is contained within the scrotum at sexual maturity. | Human |
Cell Types
| Cell ontology | Maturity | Description | Species | Replicates | Cells per replicate |
|---|---|---|---|---|---|
| CL_0000236: B cell | A lymphocyte of B lineage that is capable of B cell mediated immunity. | Human | |||
| CL_0000084: T cell | A type of lymphocyte whose defining characteristic is the expression of a T cell receptor complex. | Human | |||
| CL_0000623: natural killer cell | A lymphocyte that can spontaneously kill a variety of target cells without prior antigenic activation via germline encoded activation receptors and also regulate immune responses via cytokine release and direct contact with other cells. | Human | |||
| CL_0000235: macrophage | A mononuclear phagocyte present in variety of tissues, typically differentiated from monocytes, capable of phagocytosing a variety of extracellular particulate material, including immune complexes, microorganisms, and dead cells. | Human |
Images
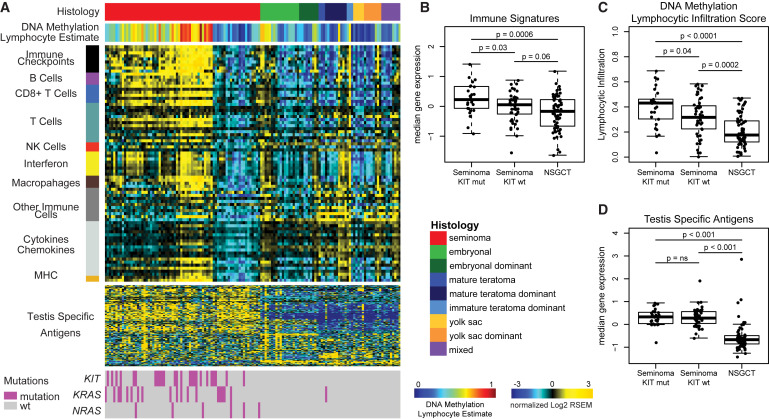
Figure 4: Immune Signatures Are High in Seminomas
(A) Gene expression data (log2 median-centered RNA-seq by expectation maximization [RSEM] values) are displayed for 78 published gene expression signatures and ordered by immune category (left vertical bar). Tumors are ordered by histology and clustered by gene expression. Annotation tracks for DNA methylation lymphocyte infiltration score and mutation status are displayed. (B–D) Boxplots of immune features comparing seminoma KIT mutant, seminoma KIT WT, and NSGCTs. (B) Median expression of immune signatures, (C) DNA methylation lymphocytic infiltration scores, and (D) median cancer-testis-specific antigen gene expression. Boxplots display the median value, upper and lower quartiles, and the whiskers represent the interquartile range. Each dot represents the value of a single sample.
Licensed under: https://creativecommons.org/licenses/by/4.0/