Transcriptome and translatome co-evolution in mammals
Wang ZY, Leushkin E, Liechti A, Ovchinnikova S, Mößinger K, Brüning T, Rummel C, Grützner F, Cardoso-Moreira M, Janich P, Gatfield D, Diagouraga B, de Massy B, Gill ME, Peters AHFM, Anders S, Kaessmann H, 11.11.2020
Abstract
Gene-expression programs define shared and species-specific phenotypes, but their evolution remains largely uncharacterized beyond the transcriptome layer1. Here we report an analysis of the co-evolution of translatomes and transcriptomes using ribosome-profiling and matched RNA-sequencing data for three organs (brain, liver and testis) in five mammals (human, macaque, mouse, opossum and platypus) and a bird (chicken). Our within-species analyses reveal that translational regulation is widespread in the different organs, in particular across the spermatogenic cell types of the testis. The between-species divergence in gene expression is around 20% lower at the translatome layer than at the transcriptome layer owing to extensive buffering between the expression layers, which especially preserved old, essential and housekeeping genes. Translational upregulation specifically counterbalanced global dosage reductions during the evolution of sex chromosomes and the effects of meiotic sex-chromosome inactivation during spermatogenesis. Despite the overall prevalence of buffering, some genes evolved faster at the translatome layer-potentially indicating adaptive changes in expression; testis tissue shows the highest fraction of such genes. Further analyses incorporating mass spectrometry proteomics data establish that the co-evolution of transcriptomes and translatomes is reflected at the proteome layer. Together, our work uncovers co-evolutionary patterns and associated selective forces across the expression layers, and provides a resource for understanding their interplay in mammalian organs.
Wang ZY, Leushkin E, Liechti A, Ovchinnikova S, Mößinger K, Brüning T, Rummel C, Grützner F, Cardoso-Moreira M, Janich P, Gatfield D, Diagouraga B, de Massy B, Gill ME, Peters AHFM, Anders S, Kaessmann H. Transcriptome and translatome co-evolution in mammals. Nature. 2020 Dec;588(7839):642-647. doi: 10.1038/s41586-020-2899-z. Epub 2020 Nov 11. PMID: 33177713; PMCID: PMC7116861.
Publication: https://doi.org/10.1038/s41586-020-2899-z Repository: https://www.ebi.ac.uk/biostudies/arrayexpress/studies/E-MTAB-7247
 Disclaimer
The publication Transcriptome and translatome co-evolution in mammals by Wang ZY, Leushkin E, Liechti A, Ovchinnikova S, Mößinger K, Brüning T, Rummel C, Grützner F, Cardoso-Moreira M, Janich P, Gatfield D, Diagouraga B, de Massy B, Gill ME, Peters AHFM, Anders S, Kaessmann H is published under an open access license: https://creativecommons.org/licenses/by-nc/4.0/. Permits non-commercial re-use, distribution, and reproduction in any medium, provided the original work is properly cited.
Curation by the MFGA team Relevant data sets presented in the publication have been identified. If possible, annotations (title, general information, conditions, processed tissue types and processed cell types) have been added based on information from the publication. Data tables and images that provide a good overview on the publication's findings on the data set have been extracted from the publication and/or supplement. If not stated otherwise, images are depicted with title and description exactly as in the publication. Tables have been adjusted to the MFGA table format. Conducted adjustments are explained in the detailed view of the tables. However, titles and descriptions have been adopted from the publication.
Data set 1: Regulation across expression layers investigated by translatome and transcriptome analysis
Translatome: Ribosome profiling
Species
| Species |
|---|
| Human |
| Rhesus Macaque |
| Mouse |
| Opossum |
| Platypus |
| Chicken |
Tissue Types
| BRENDA tissue ontology | Maturity | Description | Species | Replicates |
|---|---|---|---|---|
| BTO_0001363: testis | A typically paired male reproductive gland that produces sperm and that in most mammals is contained within the scrotum at sexual maturity. | |||
| BTO_0000142: brain | The portion of the vertebrate central nervous system that constitutes the organ of thought and neural coordination, includes all the higher nervous centers receiving stimuli from the sense organs and interpreting and correlating them to formulate the motor impulses, is made up of neurons and supporting and nutritive structures, is enclosed within the skull, and is continuous with the spinal cord through the foramen magnum. Also named encephalon. | |||
| BTO_0000759: liver | A large very vascular glandular organ of vertebrates that secretes bile and causes important changes in many of the substances contained in the blood (as by converting sugars into glycogen which it stores up until required and by forming urea). |
Cell Types
| Cell ontology | Maturity | Description | Species | Replicates | Cells per replicate |
|---|---|---|---|---|---|
| CL_0000017: spermatocyte | A male germ cell that develops from spermatogonia. The euploid primary spermatocytes undergo meiosis and give rise to the haploid secondary spermatocytes which in turn give rise to spermatids. | ||||
| CL_0000018: spermatid | A male germ cell that develops from the haploid secondary spermatocytes. Without further division, spermatids undergo structural changes and give rise to spermatozoa. | ||||
| CL_0000019: sperm | A mature male germ cell that develops from a spermatid. |
Images
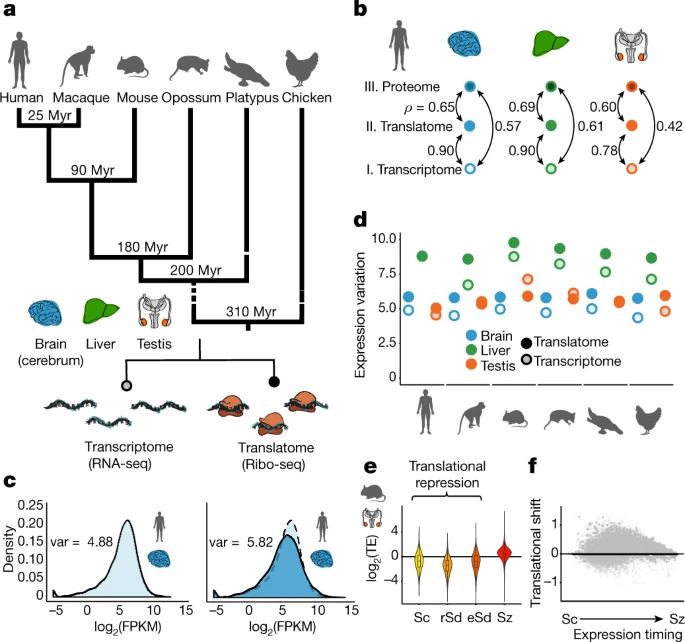
Figure 1: Regulatory dynamics across expression layers
a, Overview of the data. b, Pairwise correlations (Spearman’s ρ) between transcriptomes, translatomes and proteomes (data from a previous study) were calculated for 9,642 genes, detected at all three expression layers in human brain, liver and testis. c, Distribution of expression levels at the translatome layer (dark blue, measured using Ribo-seq), compared to the transcriptome layer (light blue, measured using RNA-seq). The expression variation (var), quantified as the variance across genes of log2(FPKM + 1)-transformed expression values (in which FPKM refers to fragments per kilobase of transcript per million reads mapped), is indicated on each graph. d, The expression variation is calculated for expression levels at the translatome (dark colours) and transcriptome (light colours) layers across organs and species. e, Translational efficiency (TE; normalized log2-transformed values) during mouse spermatogenesis was calculated for 14,979 genes detected (FPKM > 0) across all four stages (Sc, spermatocytes; rSd, round spermatids; eSd, elongating or elongated spermatids; Sz, spermatozoa). The zero line indicates the median translational efficiency of genes inferred to be expressed predominantly in somatic cells. f, Translational shift (delay) for each gene, calculated as the difference between the centres of mass for the transcriptome and translatome layers during spermatogenesis. Organ and species icons are from a previous study.
Licensed under: https://creativecommons.org/licenses/by-nc/4.0/
Data set 2: Co-evolution of expression layers investigated by translatome and transcriptome analysis
Transcriptome: RNA-Sequencing
Species
| Species |
|---|
| Human |
| Mouse |
| Rhesus Macaque |
| Mouse |
| Opossum |
| Platypus |
| Chicken |
Tissue Types
| BRENDA tissue ontology | Maturity | Description | Species | Replicates |
|---|---|---|---|---|
| BTO_0001363: testis | A typically paired male reproductive gland that produces sperm and that in most mammals is contained within the scrotum at sexual maturity. | |||
| BTO_0000142: brain | The portion of the vertebrate central nervous system that constitutes the organ of thought and neural coordination, includes all the higher nervous centers receiving stimuli from the sense organs and interpreting and correlating them to formulate the motor impulses, is made up of neurons and supporting and nutritive structures, is enclosed within the skull, and is continuous with the spinal cord through the foramen magnum. Also named encephalon. | |||
| BTO_0001363: liver | A typically paired male reproductive gland that produces sperm and that in most mammals is contained within the scrotum at sexual maturity. |
Images
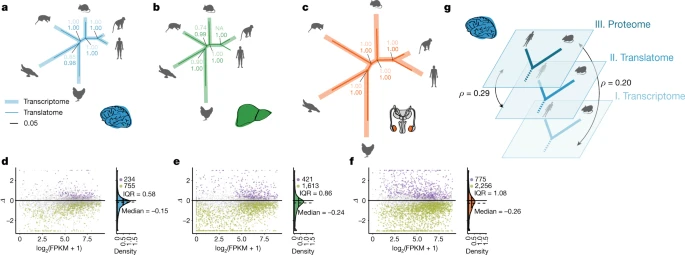
Figure 2: Evolution of gene expression across expression layers
a–c, Gene-expression phylogenies of 5,060 robustly expressed (FPKM > 1 across all libraries) 1:1 orthologues at the transcriptome (light and thick branches) and translatome (dark and thin branches) layers for brain (a), liver (b) and testis (c). Branch lengths represent the fractions of expression variation, which correspond to evolutionary changes in expression levels (Extended Data Fig. 5a). Owing to the lack of a biological replicate, the branch leading to human was omitted in the liver phylogeny for the transcriptome layer. Proportions of bootstrapped trees that support branching patterns are indicated next to the respective nodes. d–f, Differences in evolution between transcriptome and translatome layers for individual genes in brain (d), liver (e) and testis (f). The gene-expression (log2(FPKM + 1)) values are based on RNA-seq. The density distribution, median Δ, IQR of Δ and number of cases with Δ significantly higher (potentially driven by directional selection) or lower (stabilizing selection) than zero are shown to the right. All genes in graphs d–f can be interactively explored in our Ex2plorer database (https://ex2plorer.kaessmannlab.org/). g, Similarity of gene-expression (rank) changes between human and mouse brains at the proteome layer compared to the changes at the underlying translatome and transcriptome expression layers, respectively, as assessed by Spearman’s correlation coefficients (ρ). Proteomics data were retrieved from previous studies21,22. Organ and species icons are from a previous study.
Licensed under: https://creativecommons.org/licenses/by-nc/4.0/
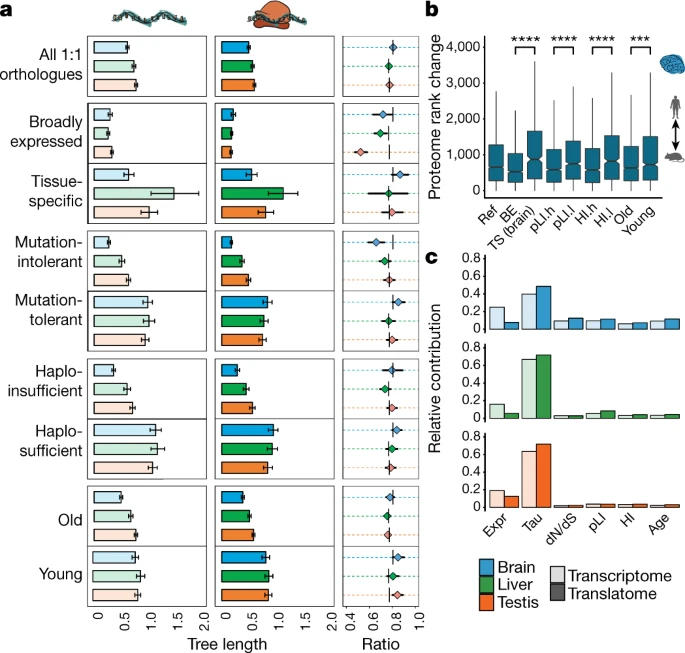
Figure 3: Co-evolution of expression layers across gene classes
a, Gene-expression divergence at the two expression layers was calculated for all 8,109 1:1 orthologues robustly expressed (FPKM > 1) in macaque, mouse and opossum (Ref), and for specific gene sets: genes with particular spatial expression patterns (broadly expressed (BE) or tissue-specific (TS)); genes with a high (mutation-intolerant, pLI.h) or low (mutation-tolerant, pLI.l) probability of being loss-of-function-intolerant; genes with high (haploinsufficient, HI.h) or low (haplosufficient, HI.l) sensitivity to copy number reductions; and genes that duplicated in the common bony vertebrate ancestor (old) or that have duplication origins in tetrapods (young). Analysis was restricted to three species to increase the number of available 1:1 orthologues. Ratios between rates of gene-expression divergence (translational to transcriptional) are shown to the right of each set of bar plots (vertical lines indicate ratios obtained for the complete set of orthologues). Error bars correspond to 95% confidence intervals, calculated on the basis of 1,000 bootstrap replicates. b, Absolute rank changes in levels of proteome gene expression were calculated across the same categories for 6,972 1:1 orthologues, detected in human and mouse brains at all three expression layers. Mann–Whitney U tests (two-sided) were performed for statistical comparisons (***P = 0.00034, ****P < 0.0001). Box plots represent the median ± 25th and 75th percentiles; whiskers are at 1.5 × IQR. c, Contribution of different factors to rates of gene-expression divergence at the transcriptional and translational layers. Expr, gene-expression level (as log2(FPKM + 1)); Tau, tissue specificity (measured as τ); dN/dS, ratio of substitutions in non-synonymous to synonymous sites; pLI, loss-of-function intolerance; HI, haploinsufficiency; age, age of the last duplication. Organ and species icons are from a previous study.
Licensed under: https://creativecommons.org/licenses/by-nc/4.0/
Data set 3: Compensatory evolution of X-linked genes across the translatome, transcriptome and proteome layers
Transcriptome: RNA-Sequencing
Species
| Species |
|---|
| Human |
| Rhesus Macaque |
| Mouse |
| Opossum |
| Platypus |
| Chicken |
Tissue Types
| BRENDA tissue ontology | Maturity | Description | Species | Replicates |
|---|---|---|---|---|
| BTO_0001363: testis | A typically paired male reproductive gland that produces sperm and that in most mammals is contained within the scrotum at sexual maturity. | Rhesus Macaque | ||
| BTO_0000142: brain | The portion of the vertebrate central nervous system that constitutes the organ of thought and neural coordination, includes all the higher nervous centers receiving stimuli from the sense organs and interpreting and correlating them to formulate the motor impulses, is made up of neurons and supporting and nutritive structures, is enclosed within the skull, and is continuous with the spinal cord through the foramen magnum. Also named encephalon. | |||
| BTO_0001363: liver | A typically paired male reproductive gland that produces sperm and that in most mammals is contained within the scrotum at sexual maturity. |
Images
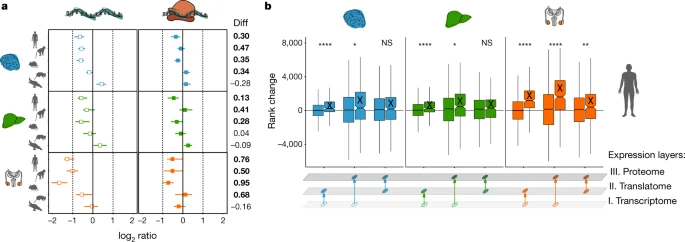
Figure 4: Compensatory evolution of X-linked genes
a, Median ratios of present-day to ancestral gene expression at the two expression layers for 1:1 orthologous X-linked genes in eutherians for brain, liver and testis. Expression levels of chicken orthologues were used as a proxy for ancestral expression levels. Platypus genes that are 1:1 orthologous to human X-linked genes and that are present and expressed in chicken were used as a control (that is, they lack evolutionary dosage reduction and MSCI). Differences (Diff) in log2-transformed ratios between expression layers are shown to the right. Cases in which the log2-transformed ratio at the translatome layer is significantly (P < 0.05, Mann–Whitney U test, two-sided) higher than at the transcriptome layer are marked in bold. Solid vertical lines indicate the expression levels expected under no dosage reduction, whereas dotted vertical lines correspond to halved (left) or doubled (right) expression levels. b, Changes in gene-expression ranks between transcriptome, translatome and proteome expression layers for autosomal (unlabelled boxes) and X-linked (‘X’-labelled boxes) genes for human brain, liver and testis, respectively. Mann–Whitney U tests (two-sided) were performed for statistical comparisons (non-significant, NS: brain P = 0.416, liver P = 0.399; *P < 0.05, **P = 0.0067, ****P < 0.0001). Box plots represent the median ± 25th and 75th percentiles; whiskers are at 1.5 × IQR. Organ and species icons are from a previous study.
Licensed under: https://creativecommons.org/licenses/by-nc/4.0/