Fertility Relevance Probability Analysis Shortlists Genetic Markers for Male Fertility Impairment
Greither T, Schumacher J, Dejung M, Behre HM, Zischler H, Butter F, Herlyn H, 25.11.2020
Abstract
Impairment of male fertility is one of the major public health issues worldwide. Nevertheless, genetic causes of male sub- and infertility can often only be suspected due to the lack of reliable and easy-to-use routine tests. Yet, the development of a marker panel is complicated by the large quantity of potentially predictive markers. Actually, hundreds or even thousands of genes could have fertility relevance. Thus, a systematic method enabling a selection of the most predictive markers out of the many candidates is required. As a criterion for marker selection, we derived a gene-specific score, which we refer to as fertility relevance probability (FRP). For this purpose, we first categorized 2,753 testis-expressed genes as either candidate markers or non-candidates, according to phenotypes in male knockout mice. In a parallel approach, 2,502 genes were classified as candidate markers or non-candidates based on phenotypes in men. Subsequently, we conducted logistic regression analyses with evolutionary rates of genes (dN/dS), transcription levels in testis relative to other organs, and connectivity of the encoded proteins in a protein-protein interaction network as covariates. In confirmation of the procedure, FRP values showed the expected pattern, thus being overall higher in genes with known relevance for fertility than in their counterparts without corresponding evidence. In addition, higher FRP values corresponded with an increased dysregulation of protein abundance in spermatozoa of 37 men with normal and 38 men with impaired fertility. Present analyses resulted in a ranking of genes according to their probable predictive power as candidate markers for male fertility impairment. Thus, AKAP4, TNP1, DAZL, BRDT, DMRT1, SPO11, ZPBP, HORMAD1, and SMC1B are prime candidates toward a marker panel for male fertility impairment. Additional candidate markers are DDX4, SHCBP1L, CCDC155, ODF1, DMRTB1, ASZ1, BOLL, FKBP6, SLC25A31, PRSS21, and RNF17. FRP inference additionally provides clues for potential new markers, thereunder TEX37 and POU4F2. The results of our logistic regression analyses are freely available at the PreFer Genes website (https://prefer-genes.uni-mainz.de/).
Greither T, Schumacher J, Dejung M, Behre HM, Zischler H, Butter F, Herlyn H. Fertility Relevance Probability Analysis Shortlists Genetic Markers for Male Fertility Impairment. Cytogenet Genome Res. 2020;160(9):506-522. doi: 10.1159/000511117. Epub 2020 Nov 25. PMID: 33238277.
Publication: https://doi.org/10.1159/000511117 Repository: https://prefer-genes.uni-mainz.de/
 Disclaimer
The publication Fertility Relevance Probability Analysis Shortlists Genetic Markers for Male Fertility Impairment by Greither T, Schumacher J, Dejung M, Behre HM, Zischler H, Butter F, Herlyn H is published under an open access license: https://creativecommons.org/licenses/by-nc/4.0/. Permits non-commercial re-use, distribution, and reproduction in any medium, provided the original work is properly cited.
Curation by the MFGA team Relevant data sets presented in the publication have been identified. If possible, annotations (title, general information, conditions, processed tissue types and processed cell types) have been added based on information from the publication. Data tables and images that provide a good overview on the publication's findings on the data set have been extracted from the publication and/or supplement. If not stated otherwise, images are depicted with title and description exactly as in the publication. Tables have been adjusted to the MFGA table format. Conducted adjustments are explained in the detailed view of the tables. However, titles and descriptions have been adopted from the publication.
Data set 1: Binary logistic regression analyses to evaluate the potential of genes as markers for male fertility impairment
Other: Other
Species
| Species |
|---|
| Human |
| Mouse |
Tissue Types
| BRENDA tissue ontology | Maturity | Description | Species | Replicates |
|---|---|---|---|---|
| BTO_0001363: testis | adult, normal-fertile | A typically paired male reproductive gland that produces sperm and that in most mammals is contained within the scrotum at sexual maturity. | Human | 37 |
| BTO_0001363: testis | adult, impaired-fertile | A typically paired male reproductive gland that produces sperm and that in most mammals is contained within the scrotum at sexual maturity. | Human | 38 |
Cell Types
| Cell ontology | Maturity | Description | Species | Replicates | Cells per replicate |
|---|---|---|---|---|---|
| CL_0000019: sperm | A mature male germ cell that develops from a spermatid. | Human | |||
| CL_0000019: sperm | A mature male germ cell that develops from a spermatid. | Mouse |
Images

Figure 1: Depiction of the workflow toward a shortlist of candidate markers for male fertility impairment
I) Fertility relevance probability (FRP) values were inferred from logistic regression analyses of genes, which were sorted according to phenotypes of male knockout (KO) mice (dataset M) and men (dataset H). II) In a parallel approach, protein expression levels were determined by quantitative proteomic analyses of spermatozoa from cohorts of normal-fertile and impaired-fertile men. III) Downstream matching led to subsets M′ and H′ containing genes, for which the proteins showed at least 2-fold differential abundances between the cohorts. In confirmation of the procedure, correlation analyses revealed that FRP values of genes were greater the higher were the fold change values of the encoded proteins. At the level of individual genes, we considered strongly varying protein levels as confirmatory evidence for the fertility relevance (dotted arrow shaft). IV) However, the selection of the most predictive candidate markers was based on elevated FRP values alone. The corresponding candidate markers are shortlisted in Table 5.
Licensed under: https://creativecommons.org/licenses/by-nc/4.0/
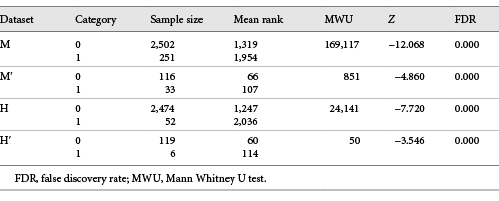
Table 1: Comparison of fertility relevance probability levels between gene categories 0 and 1 in datasets M, M′, H, and H′
Licensed under: https://creativecommons.org/licenses/by-nc/4.0/
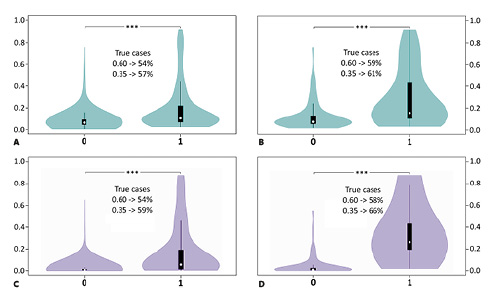
Figure 2: Violin plots giving the distribution of the fertility relevance probability (FRP) score in testis-expressed genes as derived by binary logistic regression analyses
White circles show median FRP values and box limits indicate 25th and 75th percentiles. Whiskers extend 1.5 times the interquartile range from the 25th and 75th percentiles. Categorization of genes as non-candidates (0) and candidates for male fertility relevance (1) was based on phenotypes in male knockout mice (turquoise: A, B) and men (lilac: C, D). Comparisons included the following numbers of genes (categories 0 versus 1): A Dataset M: 2,502 versus 251. B Dataset M′: 116 versus 33. C Dataset H: 2,474 versus 52. D Dataset H′: 119 versus 6. A–D FRP levels were increased for genes in category 1 relative to genes in category 0 in all 4 comparisons (p = 0.000, each, according to MWU test [***]). Percentages inside the plots refer to true cases at arbitrary FRP thresholds of 0.600 (A, B) and 0.350 (C, D). Restricting comparisons to genes, for which proteins showed at least 2-fold differential abundances between sperm of normal-fertile and impaired-fertile men (B, D) enhanced the discriminatory power in relation to the respective parental datasets (A, C).
Licensed under: https://creativecommons.org/licenses/by-nc/4.0/
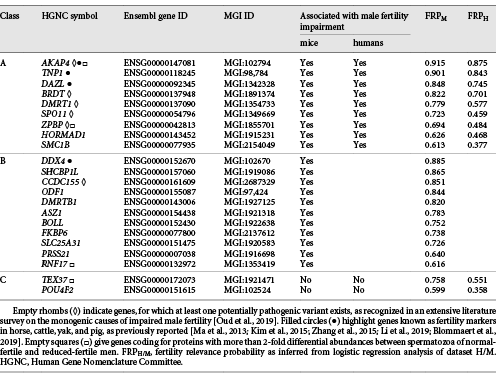
Table 2: Fertility relevance probability of candidate markers mentioned in the main text
Licensed under: https://creativecommons.org/licenses/by-nc/4.0/
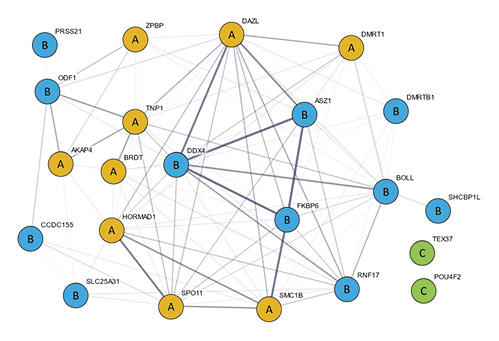
Figure 3: Protein-protein interaction network reconstructed from the 22 candidate markers in Table 2
Orange circles represent class A candidate markers that were selected based on raised fertility relevance probability values in logistic regression analyses of datasets H and M. For class B candidate markers (blue circles), the status resulted from analysis of dataset M alone. Members of class C (green circles) could be candidate markers, although such a status, to our knowledge, is not yet confirmed by corresponding phenotype data. Thickness of edges reflects the confidence of their prediction. If the threshold is set to ≥0.150, as shown above, a total of 87 edges connect all class A and B candidates to a largest connected component (LCC). However, the LCC does not contain class C members. Incremental increases in the confidence threshold would first disconnect class B candidates before excluding first class A members. Network reconstruction was performed with STRING 11.0 (https://string-db.org/).
Licensed under: https://creativecommons.org/licenses/by-nc/4.0/