The adult human testis transcriptional cell atlas
Jingtao Guo, Edward J. Grow, Hana Mlcochova, Geoffrey J. Maher, Cecilia Lindskog, Xichen Nie, Yixuan Guo, Yodai Takei, Jina Yun, Long Cai, Robin Kim, Douglas T. Carrell, Anne Goriely, James M. Hotaling, Bradley R. Cairns, 12.10.2018
Abstract
Human adult spermatogenesis balances spermatogonial stem cell (SSC) self-renewal and differentiation, alongside complex germ cell-niche interactions, to ensure long-term fertility and faithful genome propagation. Here, we performed single-cell RNA sequencing of ~6500 testicular cells from young adults. We found five niche/somatic cell types (Leydig, myoid, Sertoli, endothelial, macrophage), and observed germline-niche interactions and key human-mouse differences. Spermatogenesis, including meiosis, was reconstructed computationally, revealing sequential coding, non-coding, and repeat-element transcriptional signatures. Interestingly, we identified five discrete transcriptional/developmental spermatogonial states, including a novel early SSC state, termed State 0. Epigenetic features and nascent transcription analyses suggested developmental plasticity within spermatogonial States. To understand the origin of State 0, we profiled testicular cells from infants, and identified distinct similarities between adult State 0 and infant SSCs. Overall, our datasets describe key transcriptional and epigenetic signatures of the normal adult human testis, and provide new insights into germ cell developmental transitions and plasticity.
GUO, Jingtao, et al. The adult human testis transcriptional cell atlas. Cell research, 2018, 28. Jg., Nr. 12, S. 1141.
Publication: https://doi.org/10.1038/s41422-018-0099-2 Repository: https://www.ncbi.nlm.nih.gov/geo/query/acc.cgi?acc=GSE120508
 Disclaimer
The publication The adult human testis transcriptional cell atlas by Jingtao Guo, Edward J. Grow, Hana Mlcochova, Geoffrey J. Maher, Cecilia Lindskog, Xichen Nie, Yixuan Guo, Yodai Takei, Jina Yun, Long Cai, Robin Kim, Douglas T. Carrell, Anne Goriely, James M. Hotaling, Bradley R. Cairns is published under an open access license: https://creativecommons.org/licenses/by/4.0/. Permits to share, copy and redistribute the material in any medium or format and to adapt, remix, transform, and build upon the material for any purpose, even commercially.
Curation by the MFGA team Relevant data sets presented in the publication have been identified. If possible, annotations (title, general information, conditions, processed tissue types and processed cell types) have been added based on information from the publication. Data tables and images that provide a good overview on the publication's findings on the data set have been extracted from the publication and/or supplement. If not stated otherwise, images are depicted with title and description exactly as in the publication. Tables have been adjusted to the MFGA table format. Conducted adjustments are explained in the detailed view of the tables. However, titles and descriptions have been adopted from the publication.
Data set 1: Cell partitioning through the analysis of single cell transcriptomes
Transcriptome: Single-cell RNA-Sequencing
Species
| Species |
|---|
| Human |
Tissue Types
| BRENDA tissue ontology | Maturity | Description | Species | Replicates |
|---|---|---|---|---|
| BTO_0001363: testis | Adult | Human |
Cell Types
| Cell ontology | Maturity | Description | Species | Replicates | Cells per replicate |
|---|---|---|---|---|---|
| PLANA_0000219: spermatogonial stem cell | Adult | Spermatogonial stem cells | Human | 3 | |
| CL_0000017: spermatocyte | Adult | Early primary and late primary | Human | 3 | |
| CL_0000018: spermatid | Adult | Round and elongated spermatids (3 replicates each) | Human | 3 | |
| CL_0000019: sperm | Adult | Human | 3 | ||
| CL_0000115: endothelial cell | Adult | Human | 3 | ||
| CL_0000216: Sertoli cell | Adult | Human | 3 | ||
| CL_0000178: Leydig cell | Adult | Human | 3 | ||
| CL_0000020: spermatogonium | Adult | differentiating Spermatogonia | Human | 3 | |
| CL_0000235: macrophage | Adult | Human | 3 | ||
| CL_0002481: peritubular myoid cell | Adult | Human | 3 |
Images
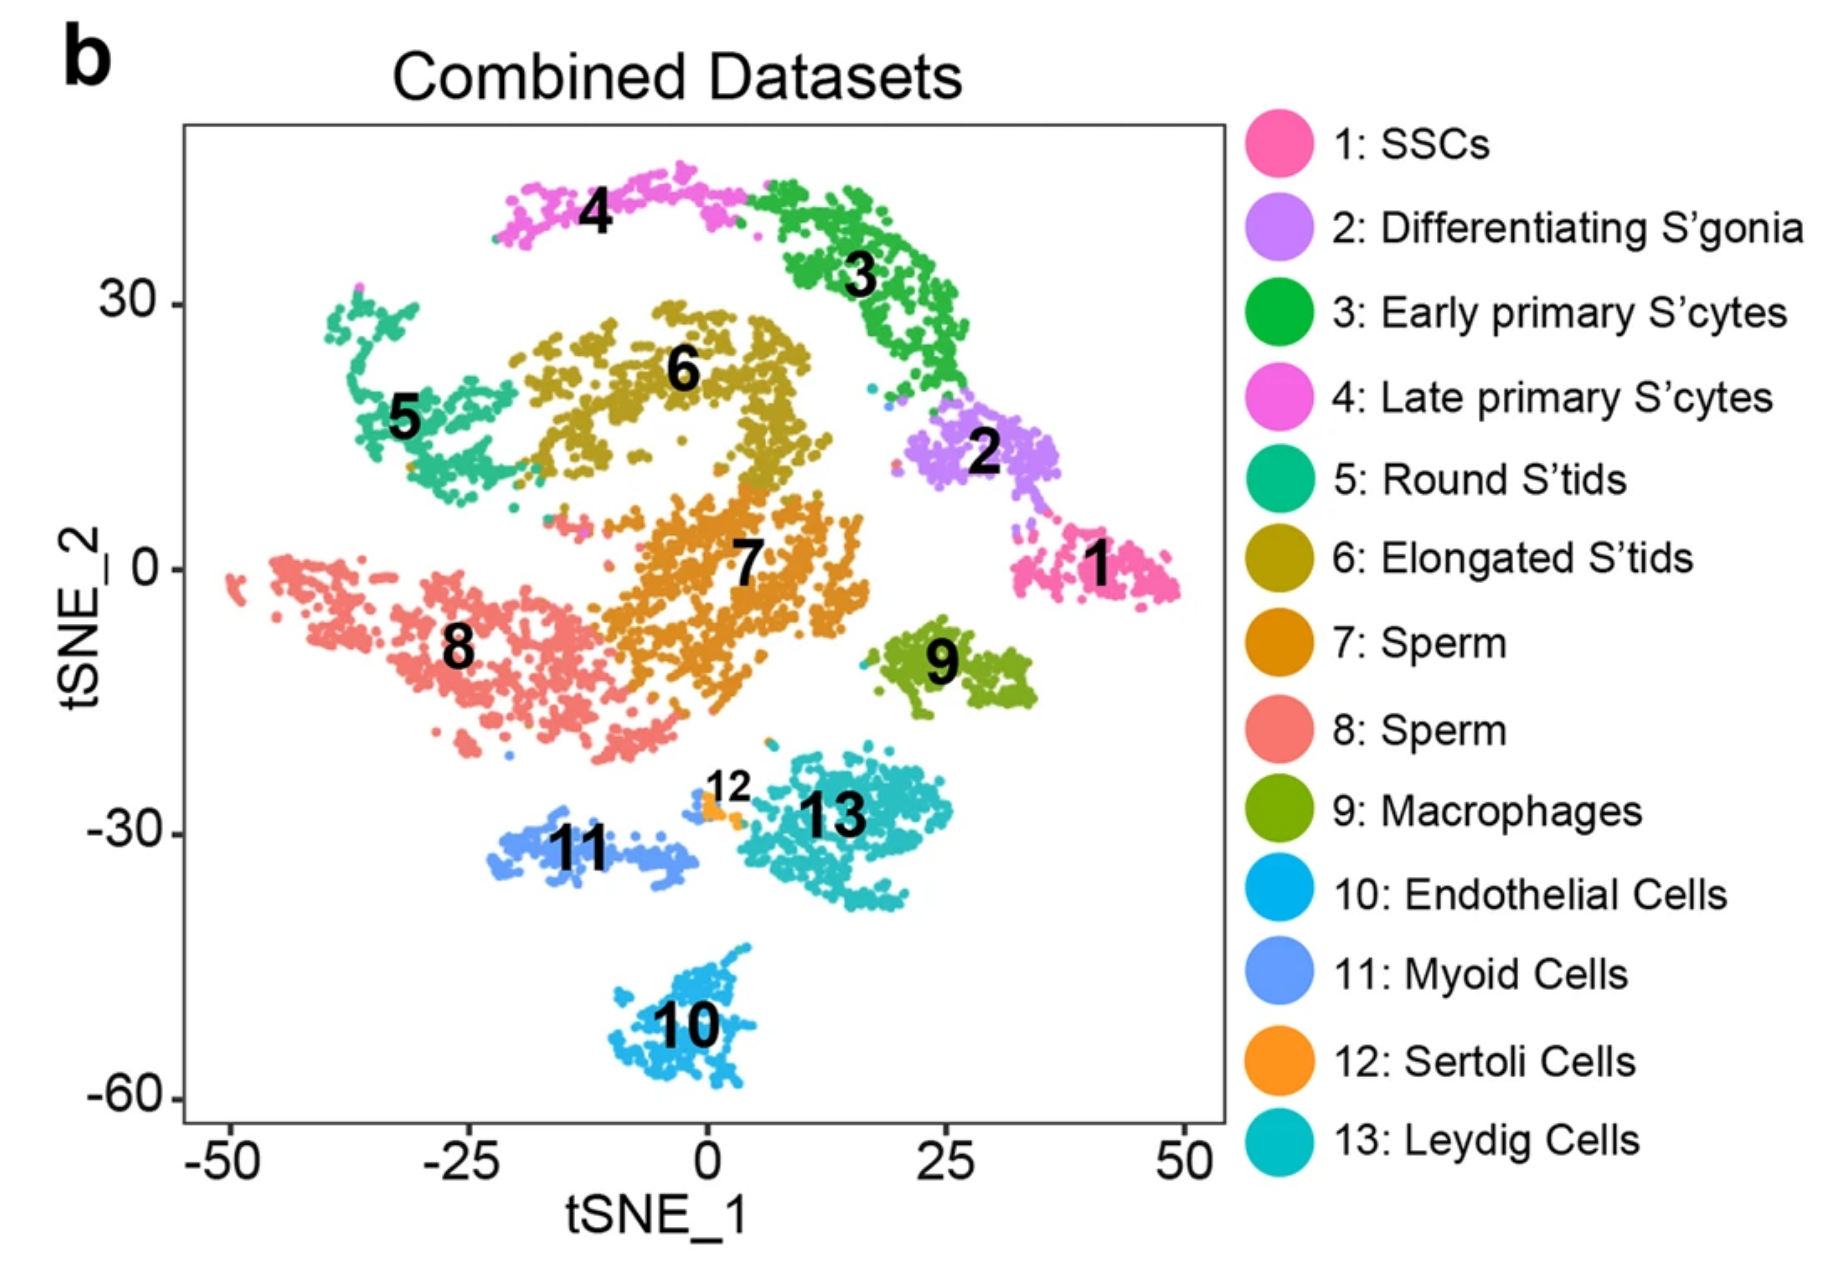
Fig. 1b: Single cell transcriptome profiling from healthy adult whole testes.
tSNE and clustering analysis of combined single-cell transcriptome data from human testes (n = 6490). Each dot represents a single cell and is colored according to its cluster identity as indicated on the figure key. The 13 cluster identities were assigned based on marker gene expression shown in Fig. 1d and Supplementary information, Fig. S2. tSNE: t-distributed stochastic neighbor embedding. Note: the 40 µm filtering step likely limits capture of the large Sertoli cells.
Licensed under: https://creativecommons.org/licenses/by/4.0/
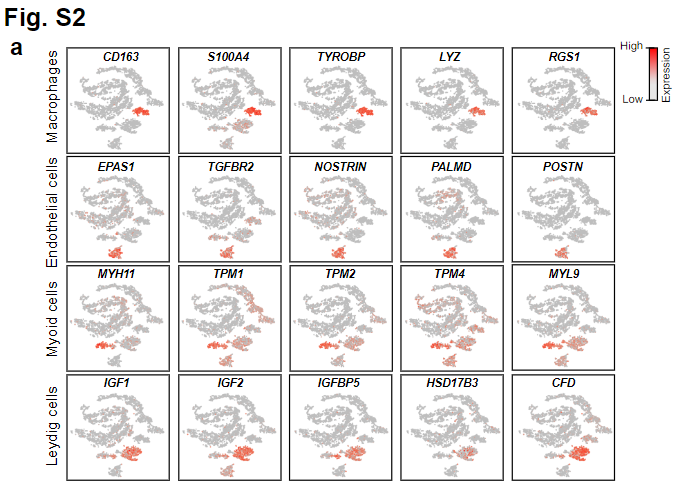
Fig. 2a (supplemental): Expression Patterns of Example Gene Markers in Different Clusters
Gene expression patterns of additional markers in niche cells. Top row: macrophages; second row: endothelial cells; third row: myoid cells; fourth row: Leydig cells.
Licensed under: https://creativecommons.org/licenses/by/4.0/
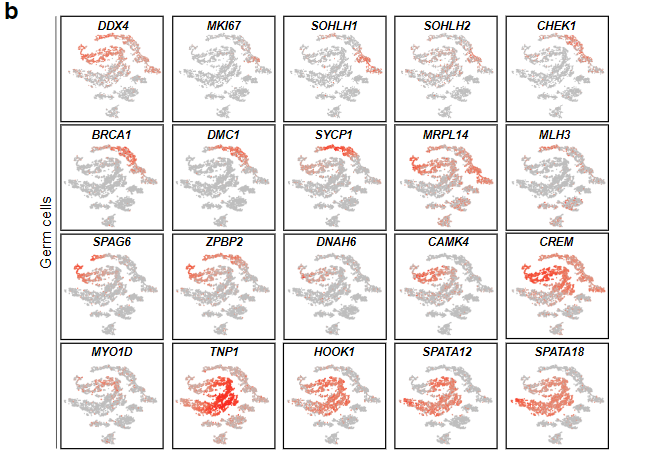
Fig. 2b (supplemental): Expression Patterns of Example Gene Markers in Different Clusters
Gene expression pattern of additional markers in germ cells. Genes marked more differentiated germ cell population as they move from top to the bottom row.
Licensed under: https://creativecommons.org/licenses/by/4.0/
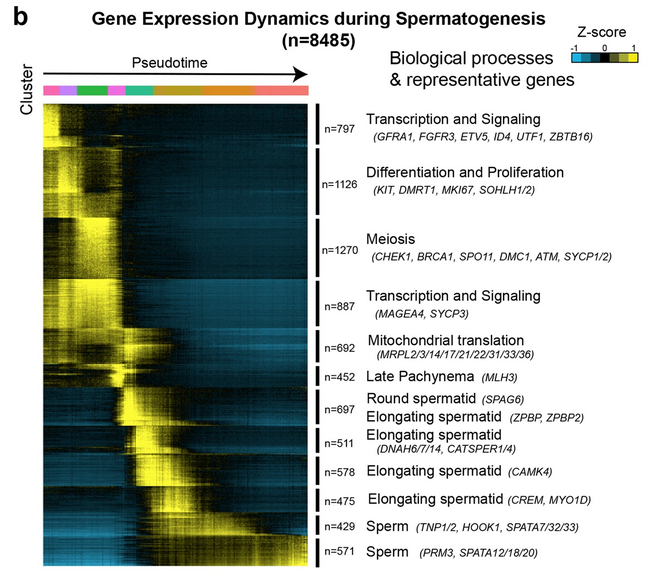
Fig. 3b: Gene expression dynamics during spermatogenesis
K-means clustering of genes exhibiting differential expression (n = 8485) across germ cell populations. Note: each row represents a gene, and each column represents a single cell, with columns/cells placed in pseudotime order as defined in Fig. 3a and depicted by a thick colored line (top, color code as in Fig. 3a). Differential gene expression levels utilize a Z score, which represents the variance from the mean, as defined on the color key in the right top corner.
Licensed under: https://creativecommons.org/licenses/by/4.0/
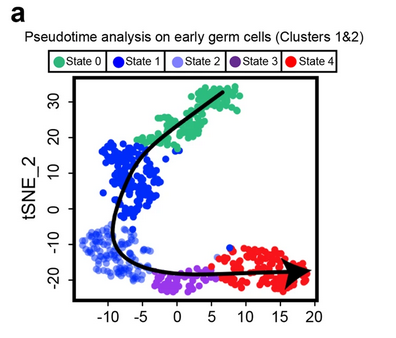
Fig. 5a: Identification of five discrete transcriptional states for SSCs
Focused analysis (tSNE, clustering and pseudotime ordering) of Clusters 1 and 2 (from Fig. 1b and 3a) reveals five discrete cellular states (States 0 to 4) during SSC development.
Licensed under: https://creativecommons.org/licenses/by/4.0/
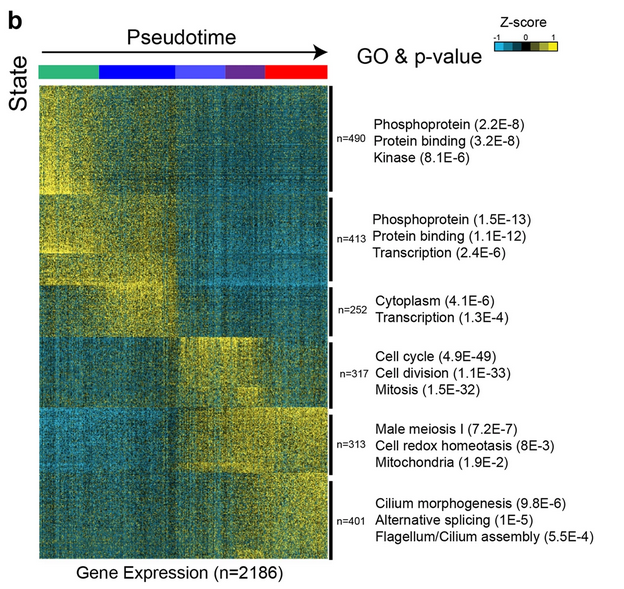
Fig. 5b: Identification of five discrete transcriptional states for SSCs
K-means clustering (k = 6) of genes exhibiting differential gene expression in States 0–4. Six gene clusters (termed S1-S6) were identified. Gene ontology associated with each gene block is shown on the right. Note: each row represents a gene, and each column represents a single cell, with columns/cells placed in pseudotime order (depicted by different colors on the top of the figure) as defined in a. Gene expression levels utilize a Z score, which depicts variance from the mean, as defined on the color key in the right top corner.
Licensed under: https://creativecommons.org/licenses/by/4.0/
Results
- Table S5: List Genes that Show Differential Expression Patterns in Different States first
- Table S2: K-means Clustering of Genes that Show Differential Expression along Germ Cell Development. first
- Table S3: Lists of Genes that Showed Differential Expression Patterns during Germ Cell Transitions. first
Data set 2: Similarity between adult state 0 spermatogonia and infant germ cells
Transcriptome: Single-cell RNA-Sequencing
Species
| Species |
|---|
| Human |
Tissue Types
| BRENDA tissue ontology | Maturity | Description | Species | Replicates |
|---|---|---|---|---|
| BTO_0001363: testis | Infant | from 12-13 month old infants; 1300 cells | Human | 3 |
Cell Types
| Cell ontology | Maturity | Description | Species | Replicates | Cells per replicate |
|---|---|---|---|---|---|
| CL_0000020: spermatogonium | Adult | Human | 3 | ||
| CL_0000586: germ cell | Infant | from 12-13 month old infants | Human | 2 | 37.0 |
Images
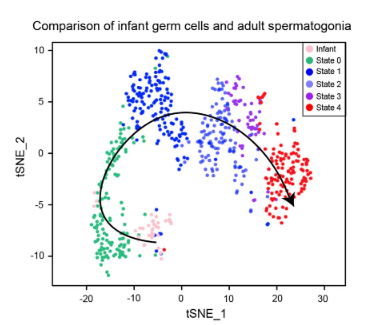
Fig. 7c: Single cell RNA profiling from infant testis and comparison to adult scRNA-seq data
tSNE andpseudotime analysis of infant germ cells and adult spermatogonia.
Licensed under: https://creativecommons.org/licenses/by/4.0/