Transcription and imprinting dynamics in developing postnatal male germline stem cells
Saher Sue Hammoud, Diana H.P. Low, Chongil Yi, Chee Leng Lee, Jon M. Oatley, Christopher J. Payne, Douglas T. Carrell, Ernesto Guccione and Bradley R. Cairns, 07.10.2015
Abstract
Postnatal spermatogonial stem cells (SSCs) progress through proliferative and developmental stages to populate the testicular niche prior to productive spermatogenesis. To better understand, we conducted extensive genomic profiling at multiple postnatal stages on subpopulations enriched for particular markers (THY1, KIT, OCT4, ID4, or GFRa1). Overall, our profiles suggest three broad populations of spermatogonia in juveniles: (1) epithelial-like spermatogonia (THY1+; high OCT4, ID4, and GFRa1), (2) more abundant mesenchymal-like spermatogonia (THY1+; moderate OCT4 and ID4; high mesenchymal markers), and (3) (in older juveniles) abundant spermatogonia committing to gametogenesis (high KIT+). Epithelial-like spermatogonia displayed the expected imprinting patterns, but, surprisingly, mesenchymal-like spermatogonia lacked imprinting specifically at paternally imprinted loci but fully restored imprinting prior to puberty. Furthermore, mesenchymal-like spermatogonia also displayed developmentally linked DNA demethylation at meiotic genes and also at certain monoallelic neural genes (e.g., protocadherins and olfactory receptors). We also reveal novel candidate receptor–ligand networks involving SSCs and the developing niche. Taken together, neonates/juveniles contain heterogeneous epithelial-like or mesenchymal-like spermatogonial populations, with the latter displaying extensive DNA methylation/chromatin dynamics. We speculate that this plasticity helps SSCs proliferate and migrate within the developing seminiferous tubule, with proper niche interaction and membrane attachment reverting mesenchymal-like spermatogonial subtype cells back to an epithelial-like state with normal imprinting profiles.
HAMMOUD, Saher Sue, et al. Transcription and imprinting dynamics in developing postnatal male germline stem cells. Genes & development, 2015, 29. Jg., Nr. 21, S. 2312-2324.
Publication: https://doi.org/10.1101/gad.261925.115
 Disclaimer
The publication Transcription and imprinting dynamics in developing postnatal male germline stem cells by Saher Sue Hammoud, Diana H.P. Low, Chongil Yi, Chee Leng Lee, Jon M. Oatley, Christopher J. Payne, Douglas T. Carrell, Ernesto Guccione and Bradley R. Cairns is published under an open access license: https://creativecommons.org/licenses/by-nc/4.0/. Granted rights: share — copy and redistribute the material in any medium or format and adapt — remix, transform, and build upon the material.
Curation by the MFGA team Relevant data sets presented in the publication have been identified. If possible, annotations (title, general information, conditions, processed tissue types and processed cell types) have been added based on information from the publication. Data tables and images that provide a good overview on the publication's findings on the data set have been extracted from the publication and/or supplement. If not stated otherwise, images are depicted with title and description exactly as in the publication. Tables have been adjusted to the MFGA table format. Conducted adjustments are explained in the detailed view of the tables. However, titles and descriptions have been adopted from the publication.
Data set 1: Genomic profiling of developing SSCs - strand specific RNA - seq
Transcriptome: Bulk RNA-Sequencing
Species
| Species |
|---|
| Mouse |
Tissue Types
| BRENDA tissue ontology | Maturity | Description | Species | Replicates |
|---|---|---|---|---|
| BTO_0001363: testis | Embryonic | Mouse |
Cell Types
| Cell ontology | Maturity | Description | Species | Replicates | Cells per replicate |
|---|---|---|---|---|---|
| PLANA_0000219: spermatogonial stem cell | Embryonic | gh4+, nanos+ cells residing at the testis periphery that self-renew and give rise to differentiating daughters that will ultimately produce haploid sperm. [ http://www.ncbi.nlm.nih.gov/pubmed/27330085 http://www.ncbi.nlm.nih.gov/pubmed/19022767 http://www.ncbi.nlm.nih.gov/pubmed/27163480 http://www.ncbi.nlm.nih.gov/pubmed/20844018 ] | Mouse | ||
| PLANA_0000219: spermatogonial stem cell | Adult | SSC; Gh4+, nanos+ cells residing at the testis periphery that self-renew and give rise to differentiating daughters that will ultimately produce haploid sperm. | Mouse |
Images
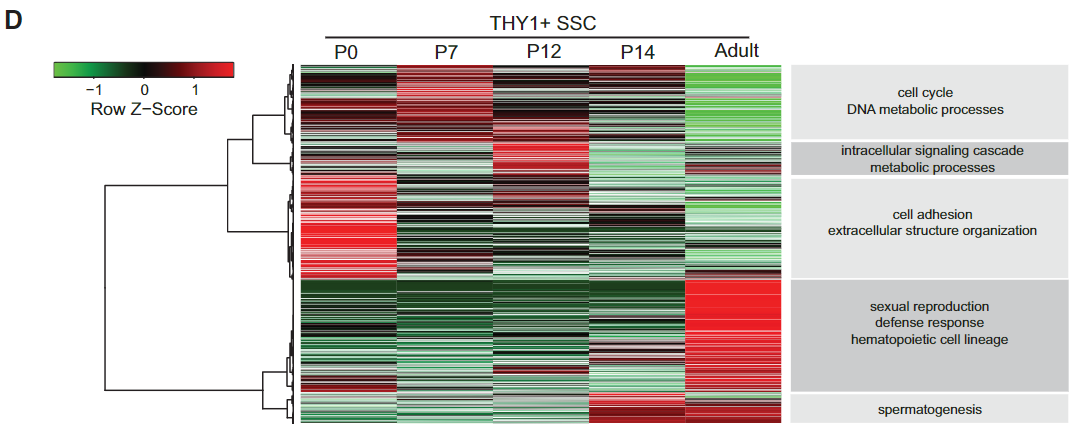
Figure 1 D: RNA-seq hierarchical clustering of developing THY1+-enriched SSCs
RNA-Seq clustering showing enriched gene ontology terms at the right, all cell purifications were performed using MACS or FACS.
Licensed under: https://creativecommons.org/licenses/by-nc/4.0/
Data set 2: DNA Methylation in SSC subtypes, indications for inproper imprinting in THY1+-enriched SSCs
Methylome: Whole Genome Bisulfite Sequencing
Species
| Species |
|---|
| Mouse |
Tissue Types
| BRENDA tissue ontology | Maturity | Description | Species | Replicates |
|---|---|---|---|---|
| BTO_0001363: testis | Embryonic | Testes | Mouse | |
| BTO_0001363: testis | Adult | Testes | Mouse |
Cell Types
| Cell ontology | Maturity | Description | Species | Replicates | Cells per replicate |
|---|---|---|---|---|---|
| PLANA_0000219: spermatogonial stem cell | Embryonic | http://purl.obolibrary.org/obo/PLANA_0000219 | Mouse | ||
| PLANA_0000219: spermatogonial stem cell | Adult | SSC; Gh4+, nanos+ cells residing at the testis periphery that self-renew and give rise to differentiating daughters that will ultimately produce haploid sperm. | Mouse |
Images
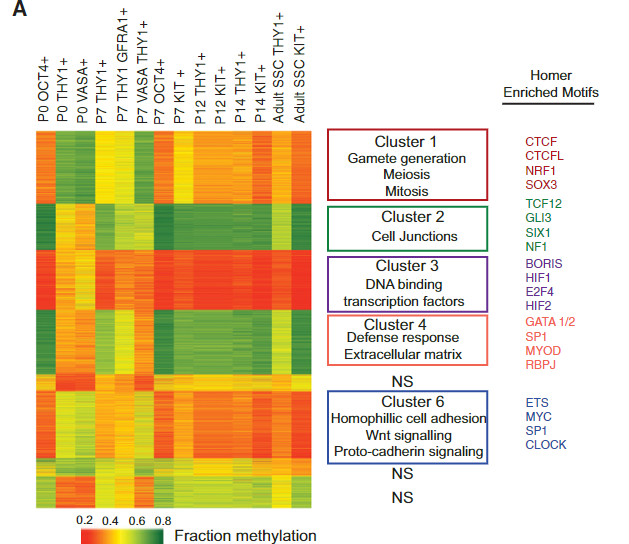
Figure 3 A: DNAme and chromatin dynamics in SSC subtypes
K-means clustering (n= 6) of DNAme (mean fraction CG methylation) at TSS regions (±1 kb) of promoters with ≥30% change in methylation. Pairwise comparisons of all germ cell stages (summed) yielded differentially methylated promoters (DMRs; criteria: three or more CpGs, eight or more reads per C,≥30% change in fraction CG methylation). Enriched GO terms are in the middle column. At the right, HOMER motif analysis reveals distinctive transcription factors for clusters 1–8. P-value < 1/100. Due to low to moderate sequencing coverage, the high-ID4 data set was removed from the differential analysis but is included in subsequent snapshot.
Licensed under: https://creativecommons.org/licenses/by-nc/4.0/
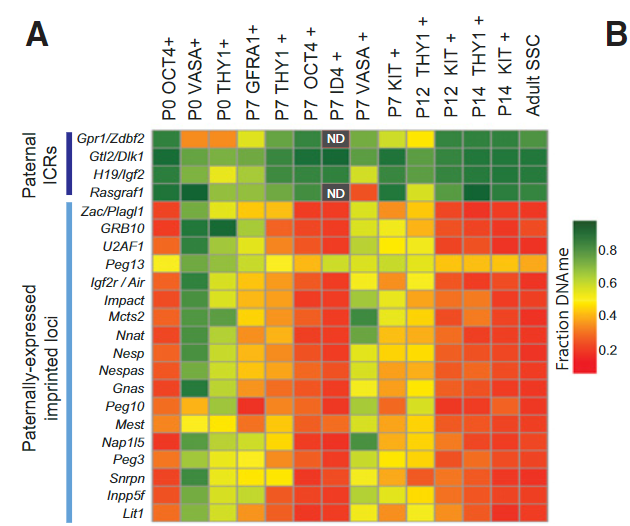
Figure 4 A: THY1+-enriched SSCs have improper imprinting (high DNAme) at most paternally expressed imprinted loci.
Heat map summarizing the fraction DNAme of the DMR at all known paternal imprinting control regions (ICRs) and paternally expressed imprinted loci. Grey boxes with ND (not determined) within are regions with insufficient sequencing coverage in high-ID4 data sets.
Licensed under: https://creativecommons.org/licenses/by-nc/4.0/
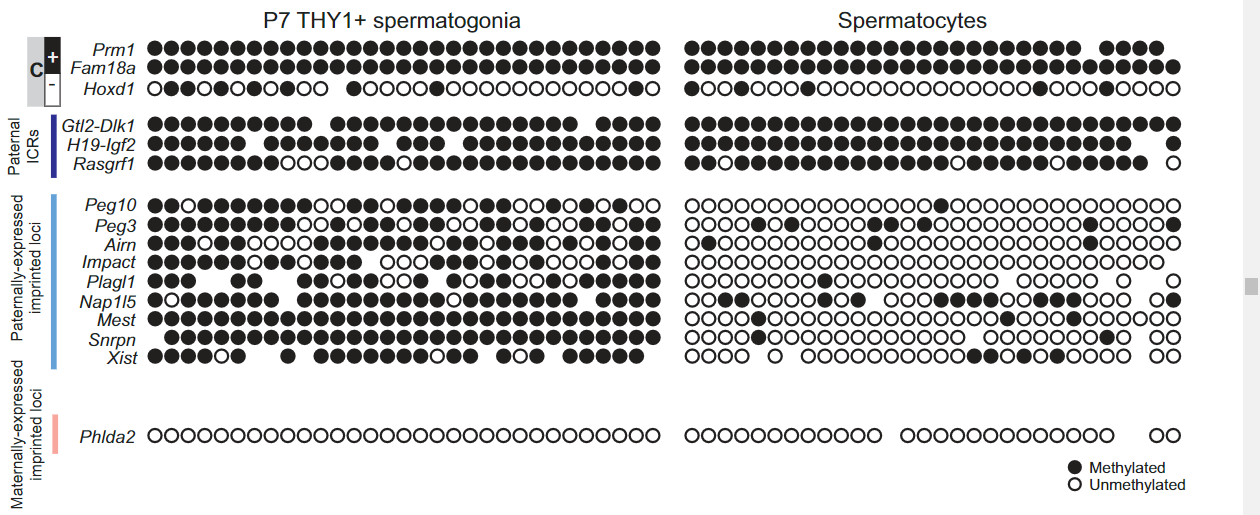
Figure 4 B: Single-cell DNAme validation of 16 loci in P7 THY1+-enriched SSCs and in spermatocytes using the Fluidigm Biomark system
Genomic loci analyzed include known methylated (M) and unmethylated (U) control loci, paternally imprinted ICRs (highlighted in dark blue), paternally expressed imprinted loci (highlighted in light blue), and maternally expressed imprinted loci (highlighted in pink).
Licensed under: https://creativecommons.org/licenses/by-nc/4.0/
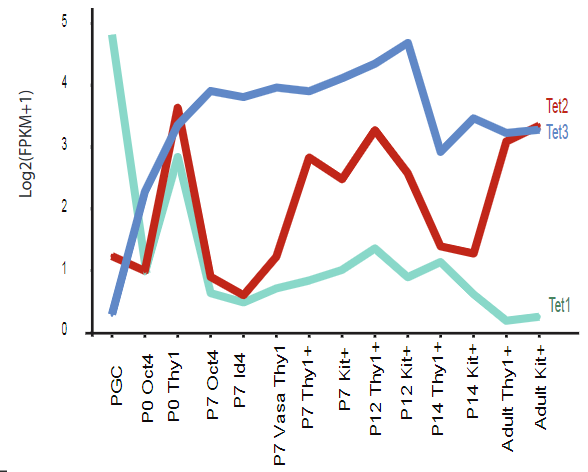
Supplementary figure 4 C: Relationships of DNA methylation to transcription at dynamic paternally or maternally expressed imprinted DMR
Line plot depicting the dynamics of DNMTs TET enzymes during germ cell development. X axis is the chronological developmental time course; Y axis is Log2 (FPKM+1).
Licensed under: https://creativecommons.org/licenses/by-nc/4.0/