Chromatin and Single-Cell RNA-Seq Profiling Reveal Dynamic Signaling and Metabolic Transitions during Human Spermatogonial Stem Cell Development
Jingtao Guo, Edward J. Grow, Chongil Yi, Hana Mlcochova, Geoffrey J. Maher, Cecilia Lindskog, Patrick J. Murphy, Candice L. Wike, Douglas T. Carrell, Anne Goriely, James M. Hotaling, Bradley R. Cairns, 05.10.2017
Abstract
Human adult spermatogonial stem cells (hSSCs) must balance self-renewal and differentiation. To understand how this is achieved, we profiled DNA methylation and open chromatin (ATAC-seq) in SSEA4+ hSSCs, analyzed bulk and single-cell RNA transcriptomes (RNA-seq) in SSEA4+ hSSCs and differentiating c-KIT+ spermatogonia, and performed validation studies via immunofluorescence. First, DNA hypomethylation at embryonic developmental genes supports their epigenetic “poising” in hSSCs for future/embryonic expression, while core pluripotency genes (OCT4 and NANOG) were transcriptionally and epigenetically repressed. Interestingly, open chromatin in hSSCs was strikingly enriched in binding sites for pioneer factors (NFYA/B, DMRT1, and hormone receptors). Remarkably, single-cell RNA-seq clustering analysis identified four cellular/developmental states during hSSC differentiation, involving major transitions in cell-cycle and transcriptional regulators, splicing and signaling factors, and glucose/mitochondria regulators. Overall, our results outline the dynamic chromatin/transcription landscape operating in hSSCs and identify crucial molecular pathways that accompany the transition from quiescence to proliferation and differentiation.
GUO, Jingtao, et al. Chromatin and single-cell RNA-seq profiling reveal dynamic signaling and metabolic transitions during human spermatogonial stem cell development. Cell Stem Cell, 2017, 21. Jg., Nr. 4, S. 533-546. e6.
Publication: https://doi.org/10.1016/j.stem.2017.09.003 Repository: https://www.ncbi.nlm.nih.gov/geo/query/acc.cgi?acc=GSE92280
 Disclaimer
The publication Chromatin and Single-Cell RNA-Seq Profiling Reveal Dynamic Signaling and Metabolic Transitions during Human Spermatogonial Stem Cell Development by Jingtao Guo, Edward J. Grow, Chongil Yi, Hana Mlcochova, Geoffrey J. Maher, Cecilia Lindskog, Patrick J. Murphy, Candice L. Wike, Douglas T. Carrell, Anne Goriely, James M. Hotaling, Bradley R. Cairns is published under an open access license: https://creativecommons.org/licenses/by/4.0/. Granted rights: share — copy and redistribute the material in any medium or format and adapt — remix, transform, and build upon the material for any purpose, even commercially.
Curation by the MFGA team Relevant data sets presented in the publication have been identified. If possible, annotations (title, general information, conditions, processed tissue types and processed cell types) have been added based on information from the publication. Data tables and images that provide a good overview on the publication's findings on the data set have been extracted from the publication and/or supplement. If not stated otherwise, images are depicted with title and description exactly as in the publication. Tables have been adjusted to the MFGA table format. Conducted adjustments are explained in the detailed view of the tables. However, titles and descriptions have been adopted from the publication.
Data set 1: Genomic Profiling of SSEA4+ hSSCs and c-KIT+ Spermatogonia - Methylome
Methylome: Whole Genome Bisulfite Sequencing
Species
| Species |
|---|
| Human |
Tissue Types
| BRENDA tissue ontology | Maturity | Description | Species | Replicates |
|---|---|---|---|---|
| BTO_0001363: testis | Adult | Human | 5 |
Cell Types
| Cell ontology | Maturity | Description | Species | Replicates | Cells per replicate |
|---|---|---|---|---|---|
| PLANA_0000219: spermatogonial stem cell | Adult | SSEA4+ Human spermatogonial stem cells (hSSCs) | Human | 5 | |
| CL_0000020: spermatogonium | Adult | c-KIT+ | Human | 5 |
Images
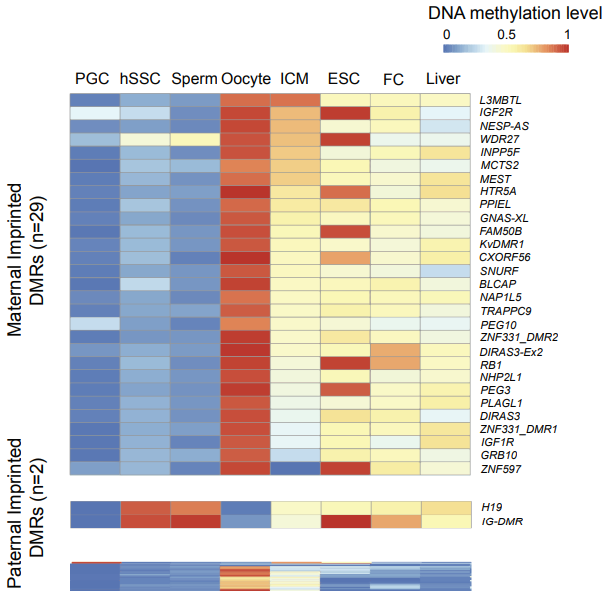
Figure S2: DNAme Dynamics in Different Tissues at Known Imprinted Sites. Related to Figure 1
Heatmap showing relative DNAme levels of known imprinted differentially methylated regions (DMRs) in different tissue types. Top: maternal imprinted DMRs (n = 29); middle: paternal imprinted DMRs (n = 2). Maternal and paternal DMR genomic coordinates are defined in (Okae et al., 2014).
Licensed under: https://creativecommons.org/licenses/by/4.0/
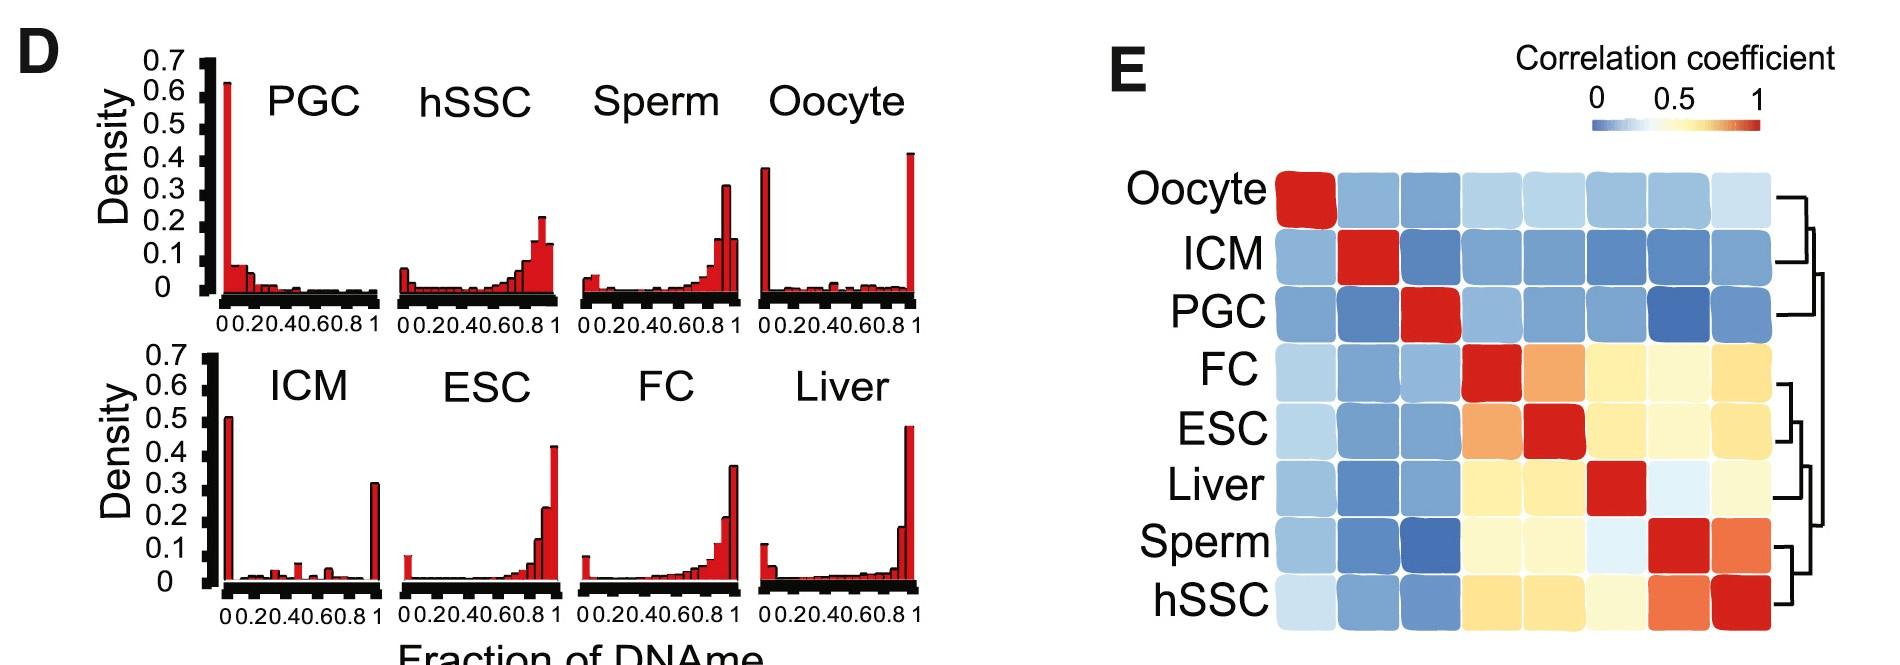
Figure 1 D and E: Genomic Profiling of Human Spermatogonial Stem Cells
D) Distribution of DNAme in human PGCs, hSSCs, sperm, egg, ICMs (inner cell mass), ESCs, FC (frontal cortex), and liver. Human PGC and liver methylation data are from Guo et al. (2015); ICM and FC methylation data are from Guo et al. (2014a); egg methylation data are from Okae et al. (2014); ESC methylation data are from Gifford et al. (2013) </br>(E) Hierarchical clustering of correlation of global DNAme in human PGCs, hSSCs, sperm, egg, ICMs, ESCs, FC, and liver.
Licensed under: https://creativecommons.org/licenses/by/4.0/
Data set 2: Genomic Profiling of SSEA4+ hSSCs and c-KIT+ Spermatogonia - Transcriptome
Transcriptome: Bulk RNA-Sequencing
Species
| Species |
|---|
| Human |
Tissue Types
| BRENDA tissue ontology | Maturity | Description | Species | Replicates |
|---|---|---|---|---|
| BTO_0001363: testis | Adult | Human | 5 |
Cell Types
| Cell ontology | Maturity | Description | Species | Replicates | Cells per replicate |
|---|---|---|---|---|---|
| PLANA_0000219: spermatogonial stem cell | Adult | SSEA4+ Human spermatogonial stem cells (hSSCs) | Human | ||
| CL_0000020: spermatogonium | Adult | c-KIT+ | Human | 5.0 |
Images
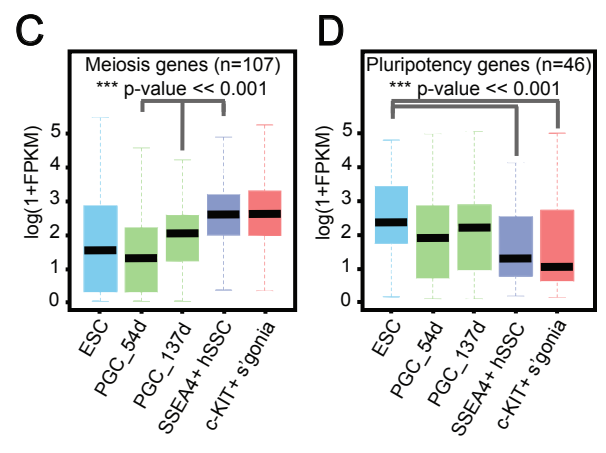
Figure S5 C and D: Profiling of Transcriptome (RNA-seq) in hSSCs. Related to Figure 3 and Figure 4.
(C) Boxplots describing the expression levels of 107 meiosis related genes in ESCs, early PGCs (54 days), later PGCs (137 days), SSEA4+ hSSCs and cKIT+ spermatogonia. Gene list from (Guo et al., 2015).</br>(D) Boxplots describing the expression levels of 46 pluripotency related genes in ESCs, early PGCs, later PGCs, SSEA4+ hSSCs and c-KIT+ spermatogonia. Gene list from (Guo et al., 2015).
Licensed under: https://creativecommons.org/licenses/by/4.0/
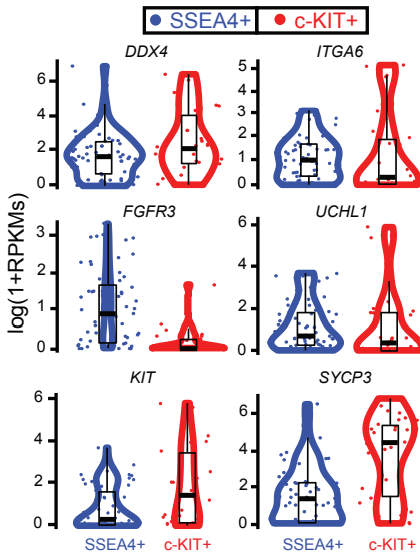
Figure S5 E: Violin- and box-plots of expression levels for selected key marker genes in SSEA4+ (blue) or c-KIT+ (red) single cells
Each dot represents the expression level within a single cell for the gene indicated on top of each panel.
Licensed under: https://creativecommons.org/licenses/by/4.0/
Data set 3: Genomic Profiling of SSEA4+ hSSCs and c-KIT+ Spermatogonia - Transcriptome (scRNA-seq in isolated SSEA4+ and c-KIT+ cells)
Transcriptome: Single-cell RNA-Sequencing
Species
| Species |
|---|
| Human |
Tissue Types
| BRENDA tissue ontology | Maturity | Description | Species | Replicates |
|---|---|---|---|---|
| BTO_0001363: testis | Adult | Human | 5 |
Cell Types
| Cell ontology | Maturity | Description | Species | Replicates | Cells per replicate |
|---|---|---|---|---|---|
| PLANA_0000219: spermatogonial stem cell | Adult | Human spermatogonial stem cells (SSEA4+ cells) | Human | 1 | 60 |
| CL_0000020: spermatogonium | Adult | c-KIT+ cells | Human | 1 | 32 |
Images
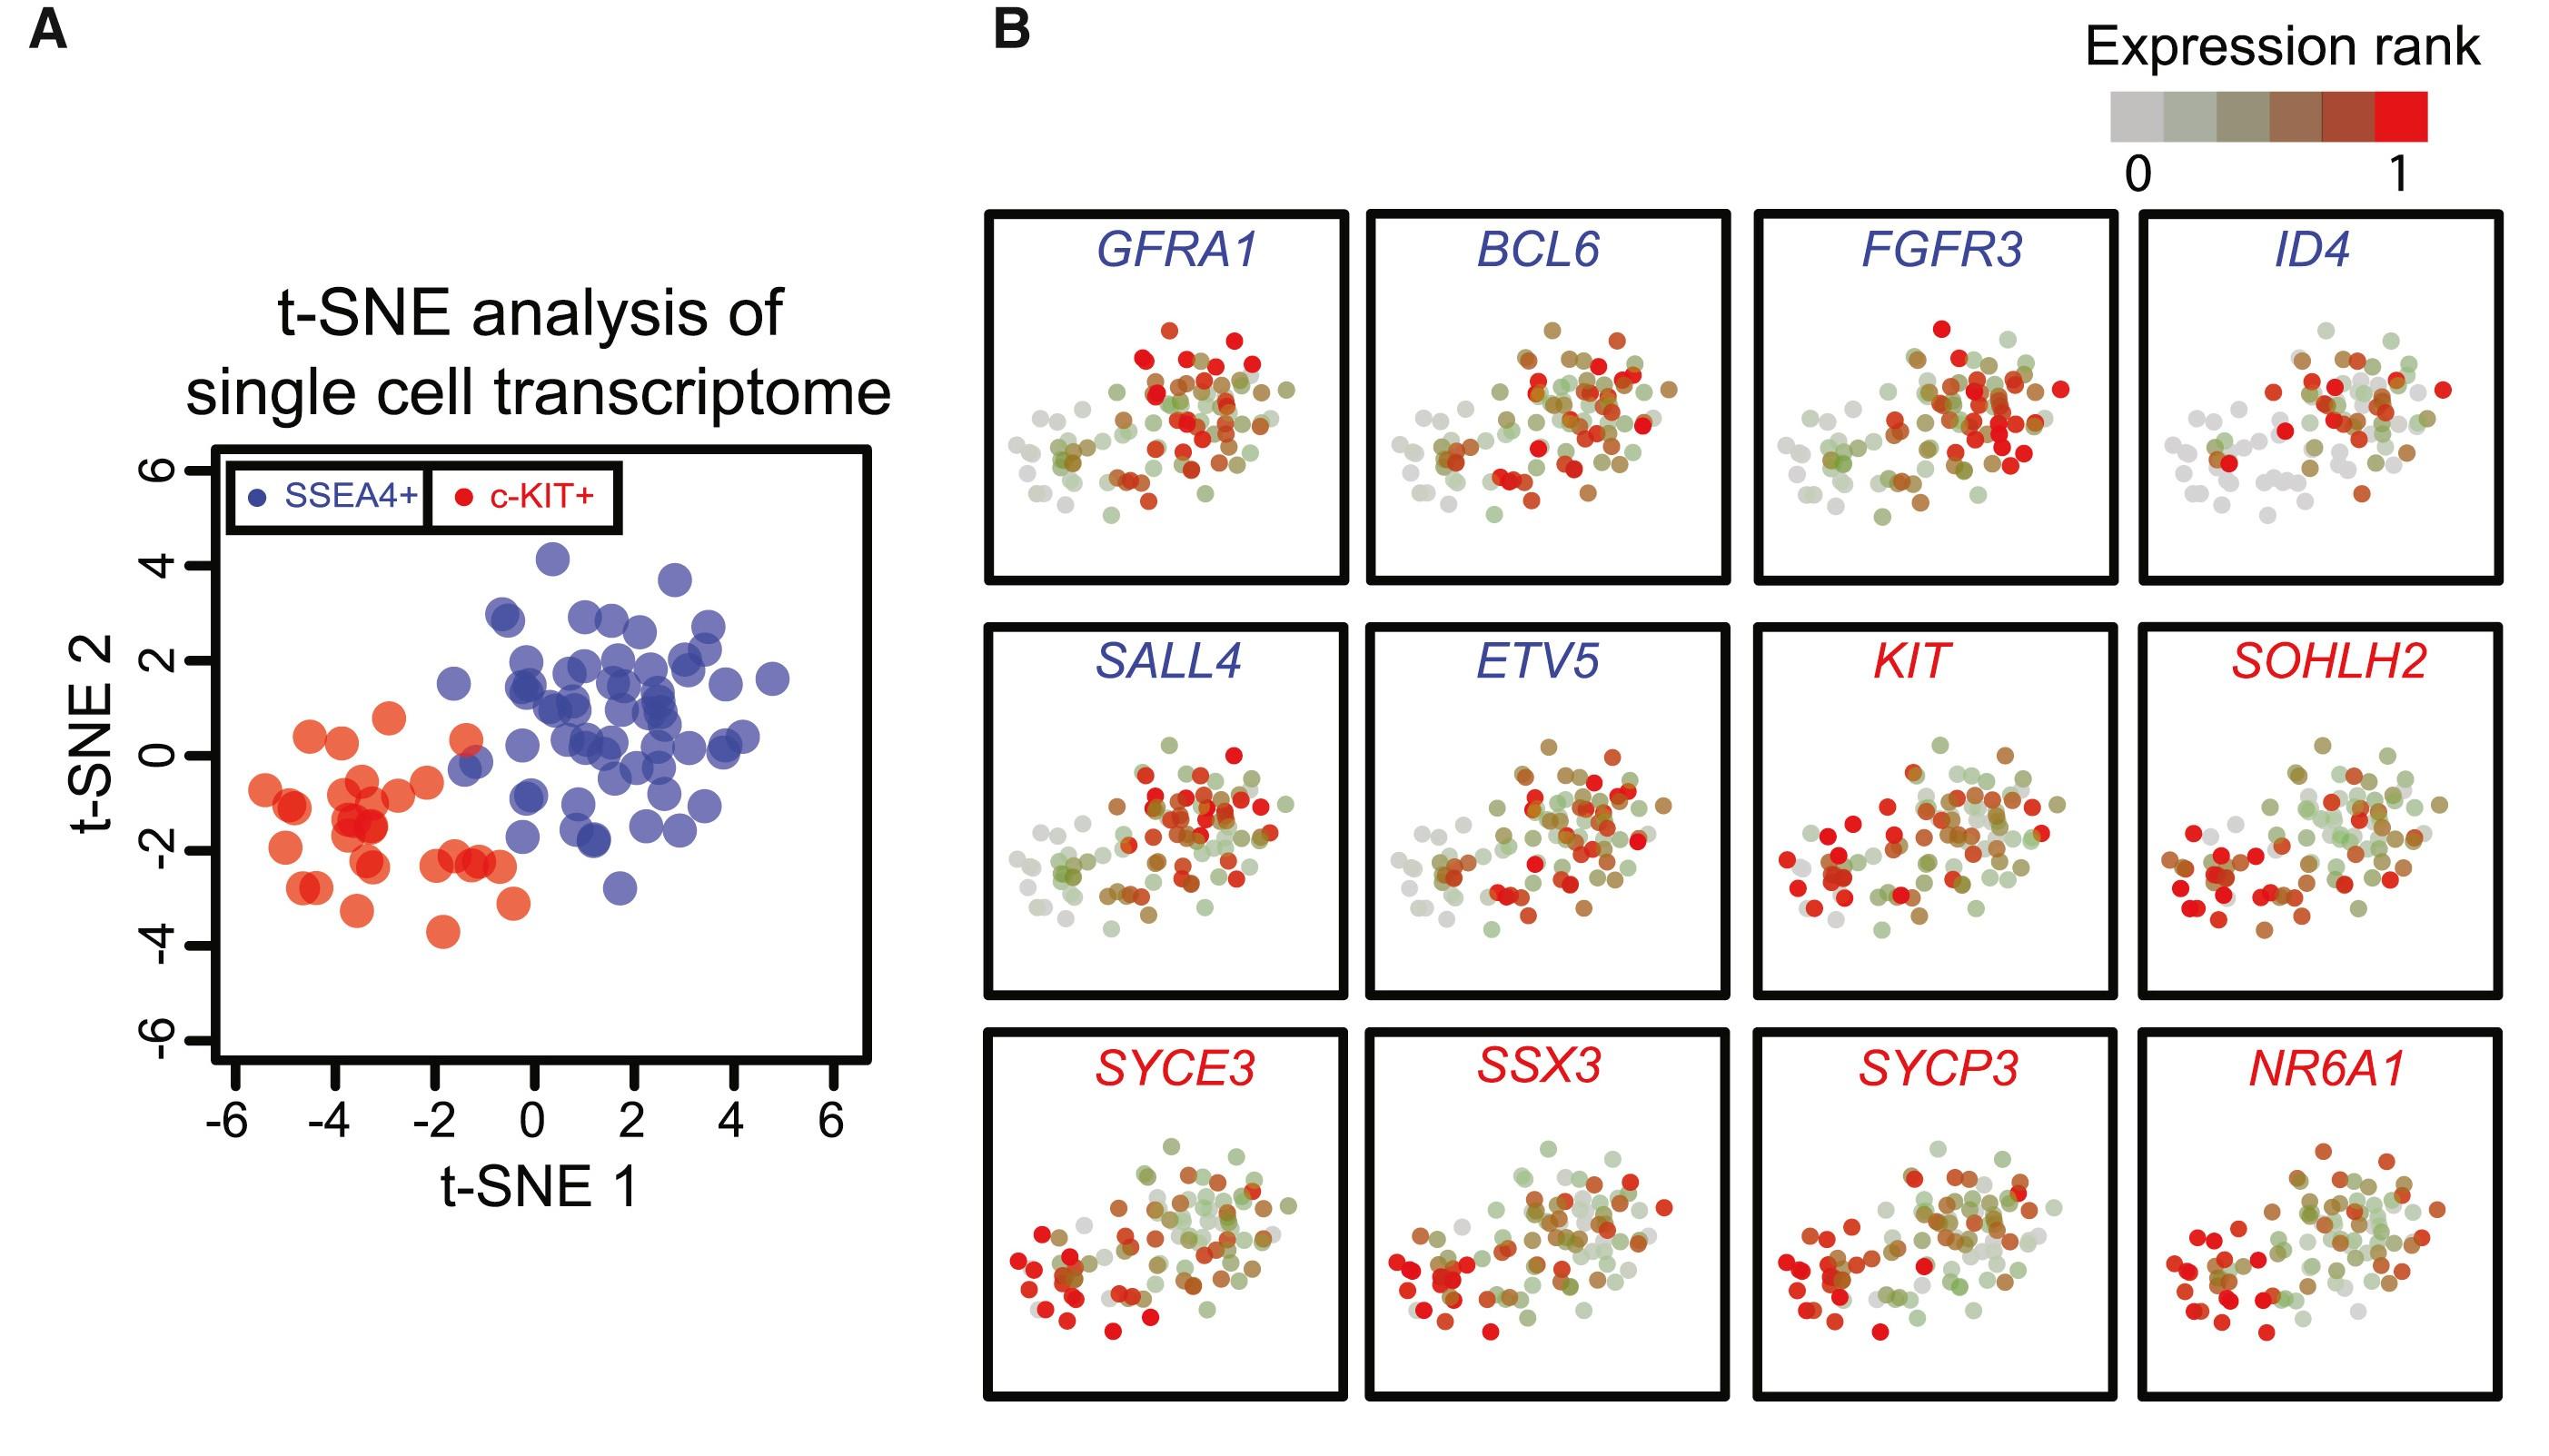
Figure 4 A and B: Single-Cell Transcriptome Analysis by t-SNE and Monocle
(A) t-SNE analysis plot of single-cell transcriptome. t-SNE, t-distributed stochastic neighbor embedding.</br>(B) Expression profiles of selected key genes in SSEA4-enriched or c-KIT-enriched single cells projected on the t-SNE plot.
Licensed under: https://creativecommons.org/licenses/by/4.0/
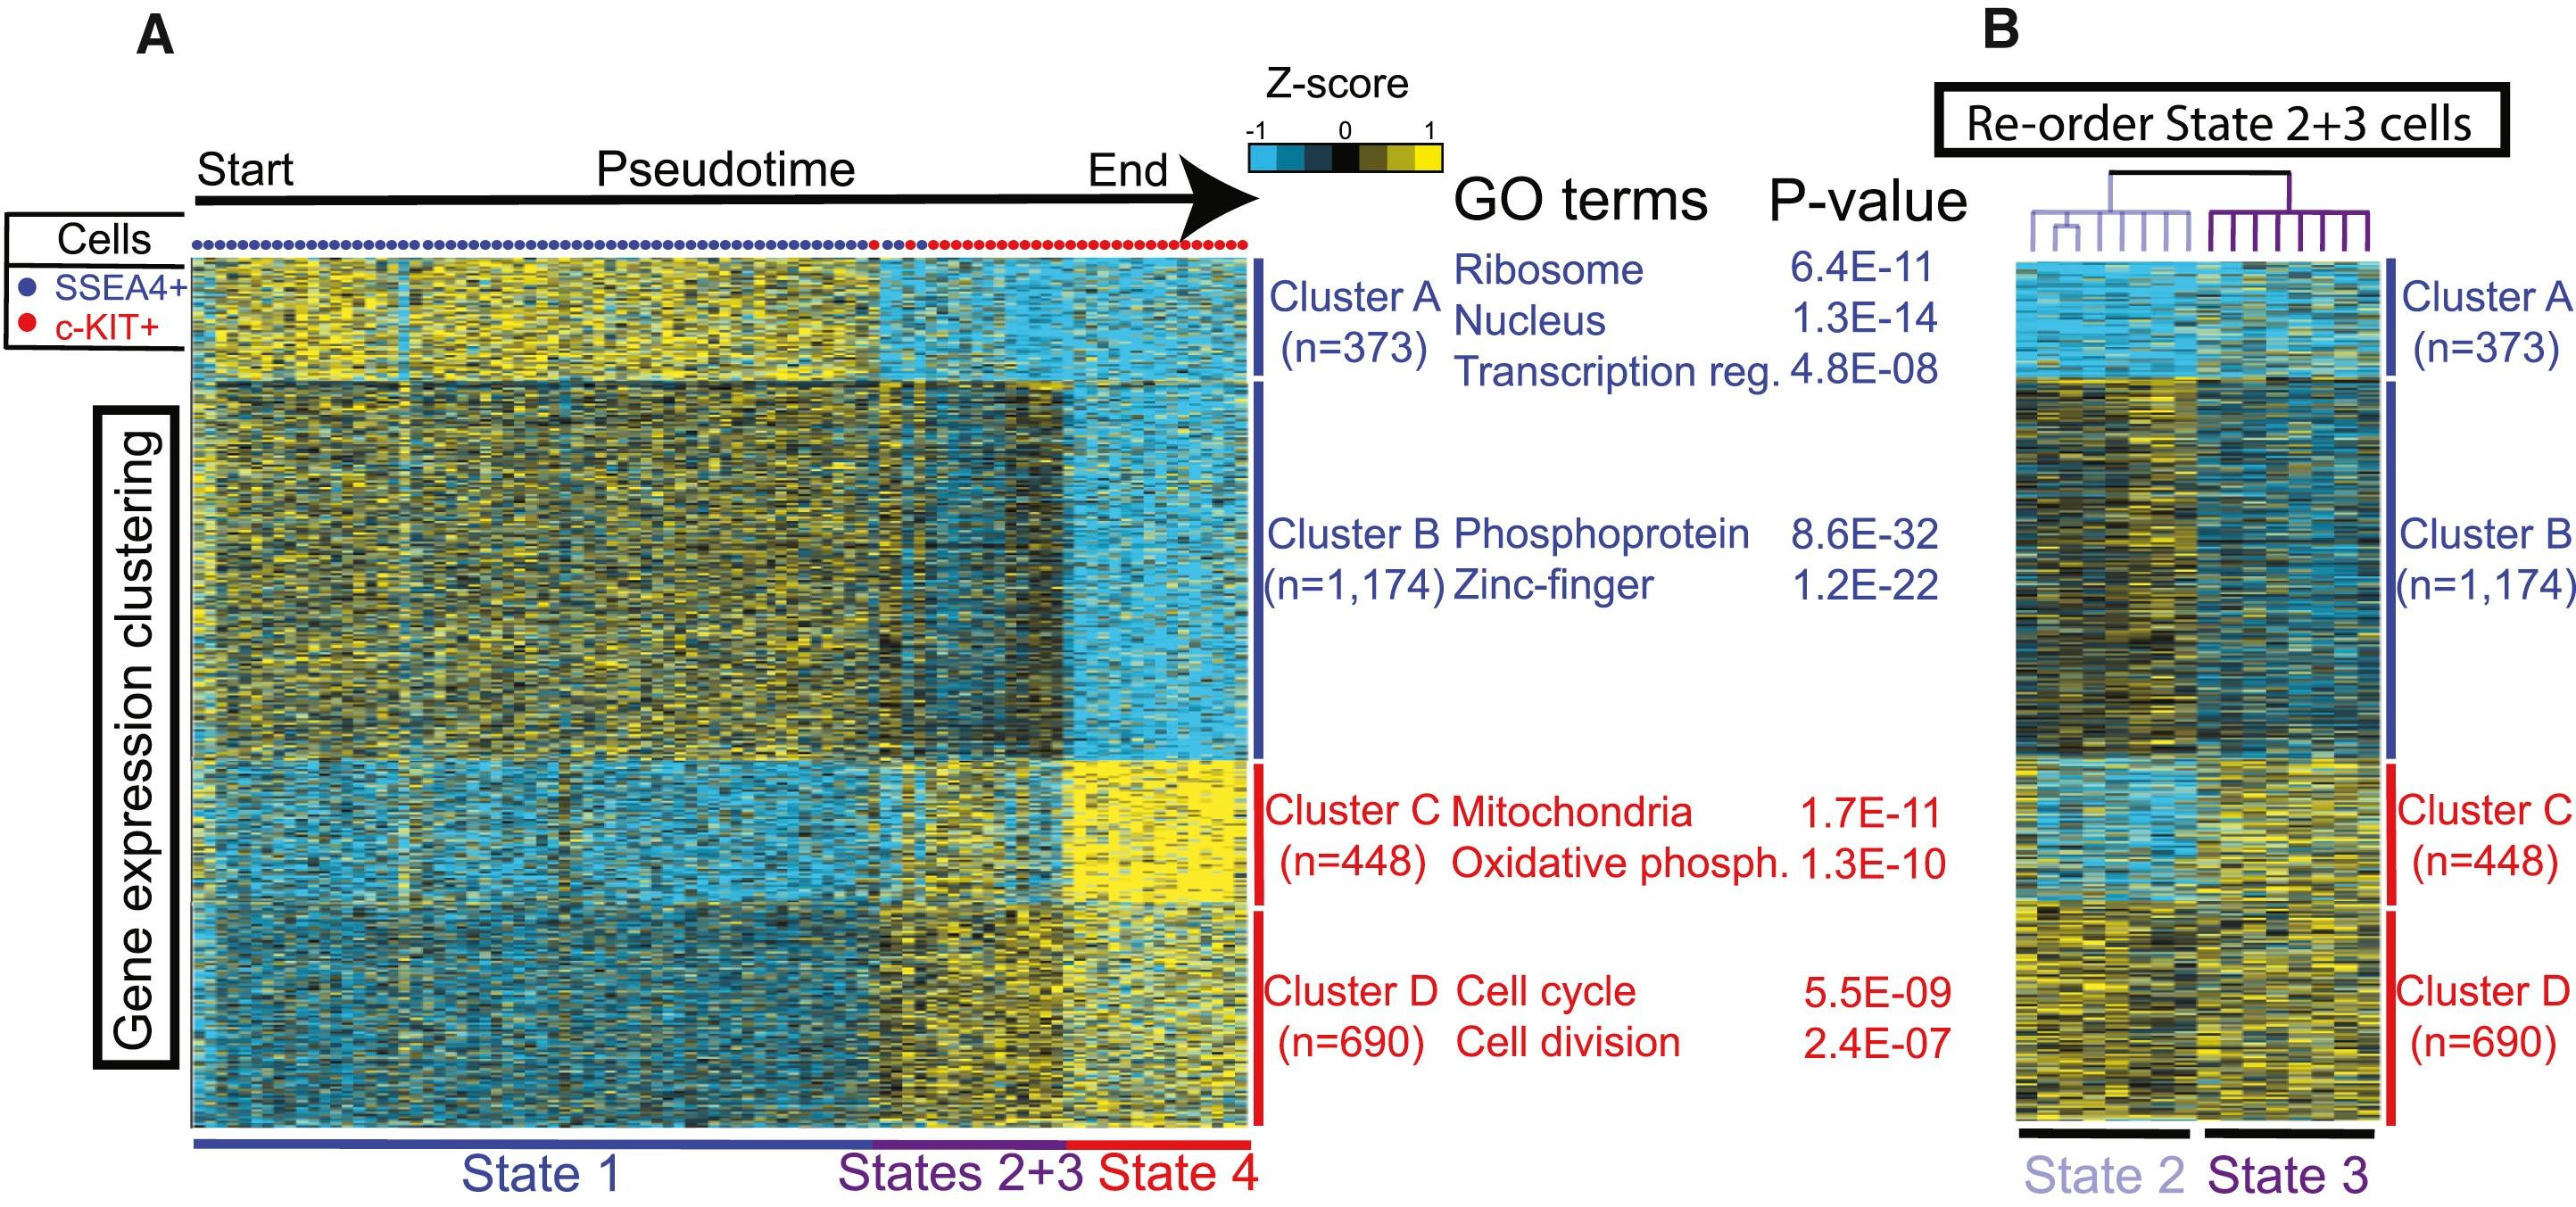
Figure 6 A and B: Monocle and Clustering Analyses Reveal Four Cell States
(A) K-means clustering (n = 4) of genes exhibiting differential expression in SSEA4+ hSSCs versus c-KIT+ spermatogonia. Note: each row represents a gene, and each column represents a single cell, with columns/cells placed in pseudotime order (as defined in Figure 4C). Gene expression levels utilize a Z score, which depicts variance from the mean.</br>(B) Hierarchical clustering of state 2 and state 3 cells from Figure 6A. Note: columns (cells) were re-ordered using hierarchical clustering, while genes (rows) were kept in the same order as Figure 6A. These state assignments were then used to refine the identity and trajectory of the minor branches highlighted on the Monocle plot in Figure 4C.
Licensed under: https://creativecommons.org/licenses/by/4.0/
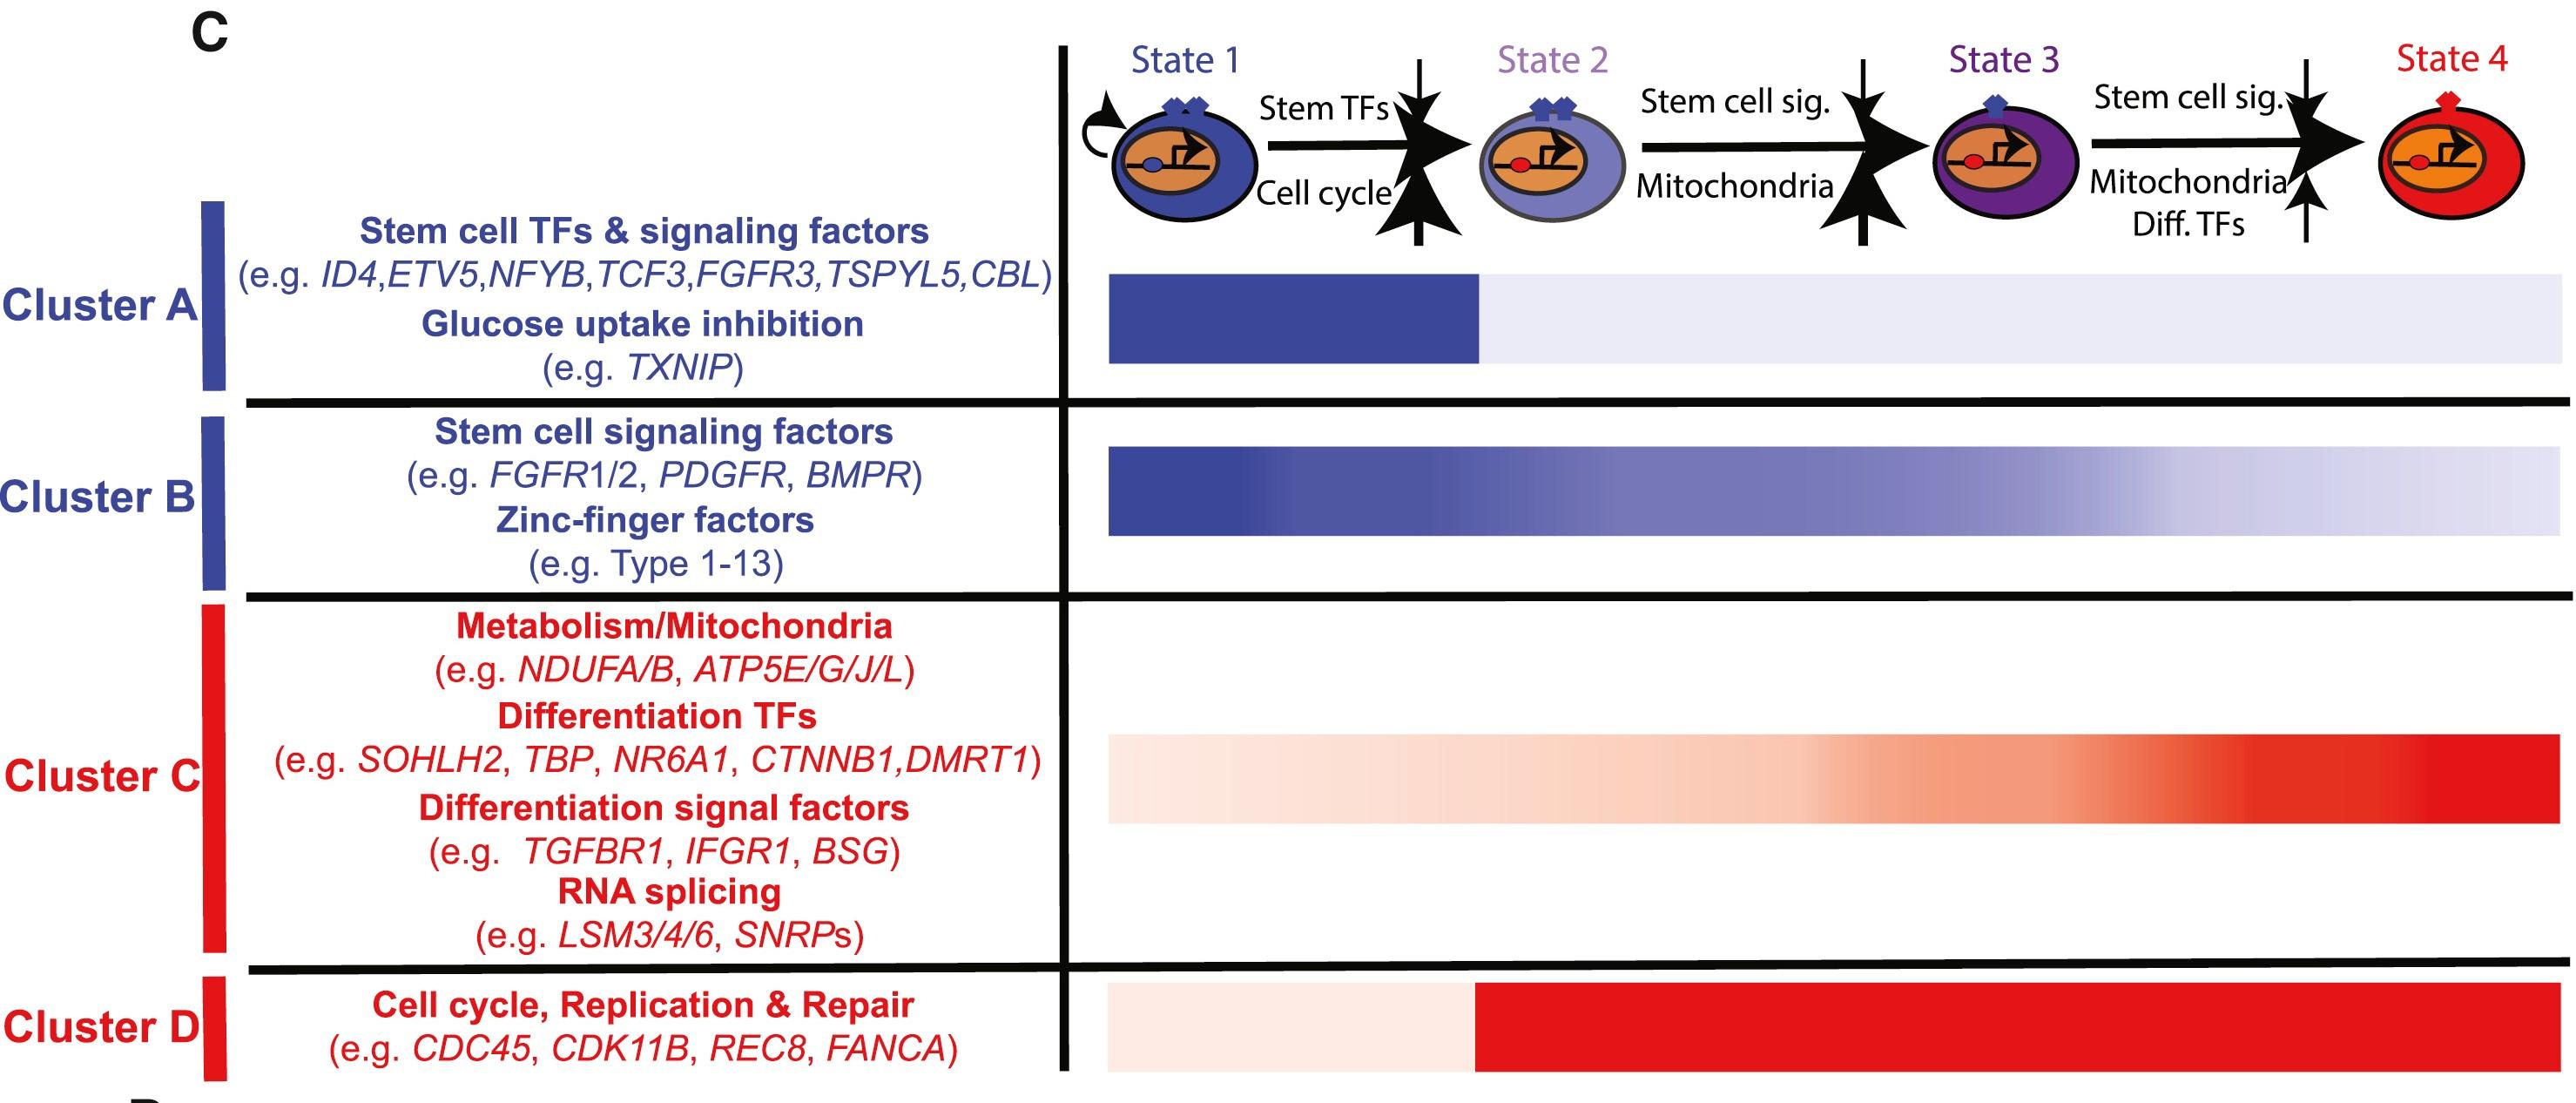
Figure 6 C: Four Gene expression clusters
Summary schematic of the combinatorial distribution of the four gene expression clusters combine to define four distinct cellular states and proposed dynamic ordering model based on gene identities and pathways.
Licensed under: https://creativecommons.org/licenses/by/4.0/
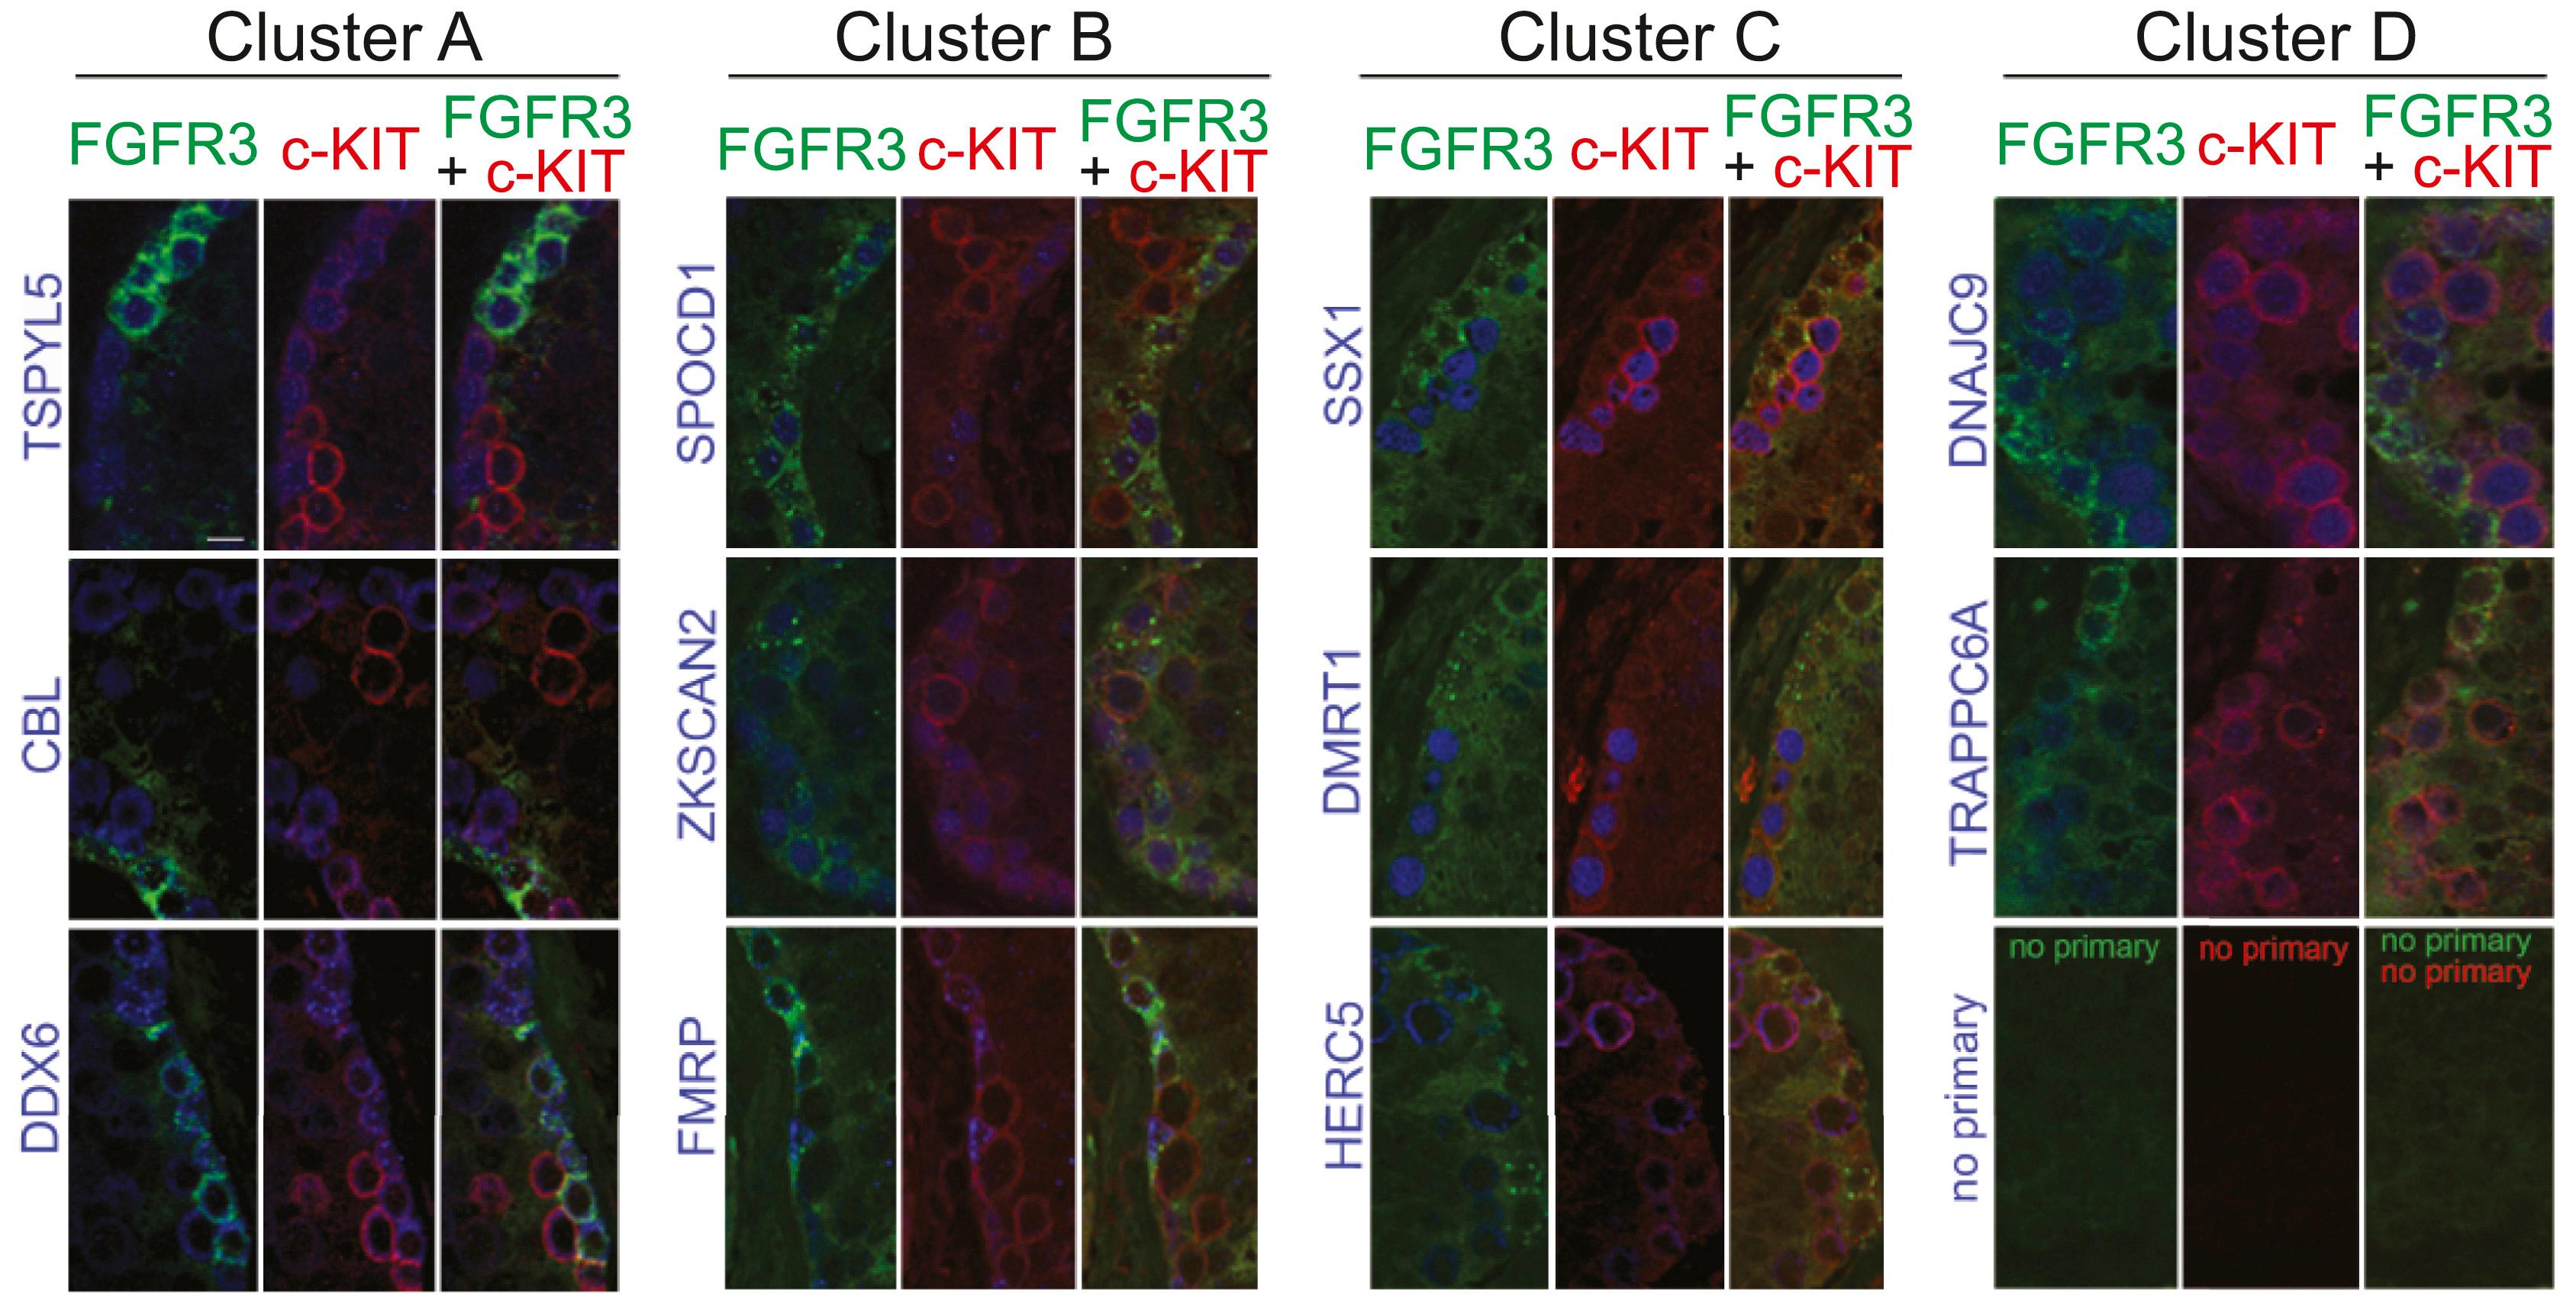
Figure 7: Validation of scRNA-Seq Data by Immunostaining of Human Seminiferous Tubules
Immunolocalization of FGFR3 (cluster A marker used as a surrogate marker to SSEA4, in green), c-KIT (cluster D marker, in red), and 11 different cluster-specific antigens (in blue) on formalin-fixed paraffin embedded (FFPE) sections of human seminiferous tubules. Each antigen (name in blue on the left side) is represented by three panels (left, co-staining with FGFR3; middle, co-staining with c-KIT; right, triple co-IF staining). For clusters A and B, the cluster-specific antigens (blue) are expressed in FGFR3+ c-KIT– cells, while, in clusters C and D, the cluster-specific antigens (blue) are expressed in FGFR3– c-KIT+ cells. The bottom right tryptic represents the negative (no primary) controls. All pictures are at the same magnification, and the white bar in the top left panel is 10 μm. See also Figure S7.
Licensed under: https://creativecommons.org/licenses/by/4.0/