Regulatory Architecture of the LβT2 Gonadotrope Cell Underlying the Response to Gonadotropin-Releasing Hormone
Frederique Ruf-Zamojski, Miguel Fribourg, Yongchao Ge, Venugopalan Nair, Hanna Pincas, Elena Zaslavsky, German Nudelman, Stephanie J. Tuminello, Hideo Watanabe, Judith L. Turgeon and Stuart C. Sealfon, 14.02.2018
Abstract
The LβT2 mouse pituitary cell line has many characteristics of a mature gonadotrope and is a widely used model system for studying the developmental processes and the response to gonadotropin-releasing hormone (GnRH). The global epigenetic landscape, which contributes to cell-specific gene regulatory mechanisms, and the single-cell transcriptome response variation of LβT2 cells have not been previously investigated. Here, we integrate the transcriptome and genome-wide chromatin accessibility state of LβT2 cells during GnRH stimulation. In addition, we examine cell-to-cell variability in the transcriptional response to GnRH using Gel bead-in-Emulsion Drop-seq technology. Analysis of a bulk RNA-seq data set obtained 45 min after exposure to either GnRH or vehicle identified 112 transcripts that were regulated >4-fold by GnRH (FDR < 0.05). The top regulated transcripts constitute, as determined by Bayesian massive public data integration analysis, a human pituitary-relevant coordinated gene program. Chromatin accessibility [assay for transposase-accessible chromatin with high-throughput sequencing (ATAC-seq)] data sets generated from GnRH-treated LβT2 cells identified more than 58,000 open chromatin regions, some containing notches consistent with bound transcription factor footprints. The study of the most prominent open regions showed that 75% were in transcriptionally active promoters or introns, supporting their involvement in active transcription. Lhb, Cga, and Egr1 showed significantly open chromatin over their promoters. While Fshb was closed over its promoter, several discrete significantly open regions were found at −40 to −90 kb, which may represent novel upstream enhancers. Chromatin accessibility determined by ATAC-seq was associated with high levels of gene expression determined by RNA-seq. We obtained high-quality single-cell Gel bead-in-Emulsion Drop-seq transcriptome data, with an average of >4,000 expressed genes/cell, from 1,992 vehicle- and 1,889 GnRH-treated cells. While the individual cell expression patterns showed high cell-to-cell variation, representing both biological and measurement variation, the average expression patterns correlated well with bulk RNA-seq data. Computational assignment of each cell to its precise cell cycle phase showed that the response to GnRH was unaffected by cell cycle. To our knowledge, this study represents the first genome-wide epigenetic and single-cell transcriptomic characterization of this important gonadotrope model. The data have been deposited publicly and should provide a resource for hypothesis generation and further study.
RUF-ZAMOJSKI, Frederique, et al. Regulatory architecture of the LβT2 gonadotrope cell underlying the response to gonadotropin-releasing hormone. Frontiers in endocrinology, 2018, 9. Jg., S. 34.
Publication: https://www.frontiersin.org/articles/10.3389/fendo.2018.00034/full Repository: https://www.ncbi.nlm.nih.gov/geo/query/acc.cgi?acc=GSE42120; https://www.ncbi.nlm.nih.gov/geo/query/acc.cgi?acc=GSE102480; https://www.ncbi.nlm.nih.gov/geo/query/acc.cgi?acc=GSE102480
 Disclaimer
The publication Regulatory Architecture of the LβT2 Gonadotrope Cell Underlying the Response to Gonadotropin-Releasing Hormone by Frederique Ruf-Zamojski, Miguel Fribourg, Yongchao Ge, Venugopalan Nair, Hanna Pincas, Elena Zaslavsky, German Nudelman, Stephanie J. Tuminello, Hideo Watanabe, Judith L. Turgeon and Stuart C. Sealfon is published under an open access license: https://creativecommons.org/licenses/by/4.0/. Granted rights: share — copy and redistribute the material in any medium or format and adapt — remix, transform, and build upon the material for any purpose, even commercially.
Curation by the MFGA team Relevant data sets presented in the publication have been identified. If possible, annotations (title, general information, conditions, processed tissue types and processed cell types) have been added based on information from the publication. Data tables and images that provide a good overview on the publication's findings on the data set have been extracted from the publication and/or supplement. If not stated otherwise, images are depicted with title and description exactly as in the publication. Tables have been adjusted to the MFGA table format. Conducted adjustments are explained in the detailed view of the tables. However, titles and descriptions have been adopted from the publication.
Data set 1: Transcriptome profiling- LβT2 cells were serum starved overnight and stimulated with either 5 nm GnRH or vehicle for 45 min.
Transcriptome: Bulk RNA-Sequencing
Species
| Species |
|---|
| Mouse |
Tissue Types
| BRENDA tissue ontology | Maturity | Description | Species | Replicates |
|---|---|---|---|---|
| BTO_0000534: gonad | Adult | Mouse |
Cell Types
| Cell ontology | Maturity | Description | Species | Replicates | Cells per replicate |
|---|---|---|---|---|---|
| Adult | Mouse pituitary cell line (LßT2 cells) | Mouse | |||
| Adult | LßT2- GnRH treated | Mouse | |||
| Adult | LßT2- vehicle treated | Mouse |
Images
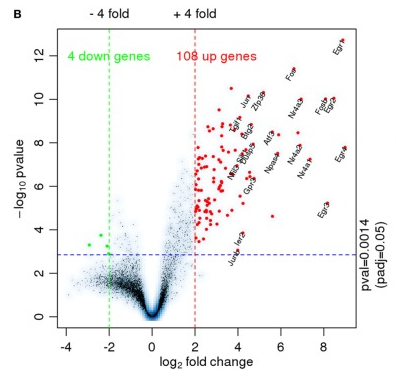
Figure 2 B: RNA-seq data analysis- Volcano plot
Volcano plot with the log2 fold changes in gene expression after GnRH treatment on the x-axis and the statistical significance (−log10 p value) on the y-axis. The gene symbols of 21 annotated genes with at least a 16-fold expression change are displayed.
Licensed under: https://creativecommons.org/licenses/by/4.0/
Results
Data set 2: Genome-Wide Mapping of Chromatin Accessibility in LβT2 Cells- ATAC Seq_LβT2 cells treated with 2 nM GnRH pulses every 2 h for a duration of 6 h and 45 min
Other: Genome-wide Chromatin Accessibility
Species
| Species |
|---|
| Mouse |
Tissue Types
| BRENDA tissue ontology | Maturity | Description | Species | Replicates |
|---|---|---|---|---|
| BTO_0000534: gonad | Adult | Mouse |
Cell Types
| Cell ontology | Maturity | Description | Species | Replicates | Cells per replicate |
|---|---|---|---|---|---|
| Adult | Mouse pituitary cell line (LβT2 cells) | Mouse | |||
| Adult | LßT2- GnRH treated | Mouse |
Images
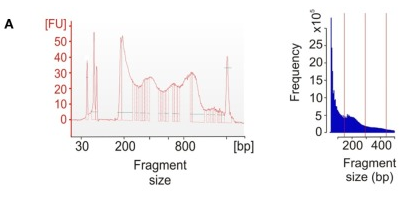
Figure 3 A: Assay for transposase-accessible chromatin with high-throughput sequencing (ATAC-seq) data analysis-Library and sequence fragment size distribution showing a periodicity characteristic of the effect of nucleosome binding
Licensed under: https://creativecommons.org/licenses/by/4.0/
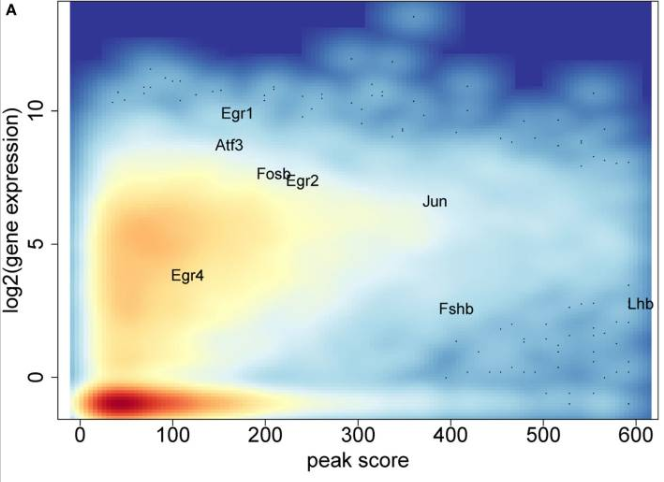
Figure 4 A: Chromatin accessibility and gene expression landscape-Average log2 gene expression
Average log2 gene expression for each gene from the RNA-seq experiment compared to the highest assay for transposase-accessible chromatin with high-throughput sequencing (ATAC-seq) peak score associated with the same gene. Color intensity indicates density of gene population, with red representing the highest density and light blue the lowest.
Licensed under: https://creativecommons.org/licenses/by/4.0/
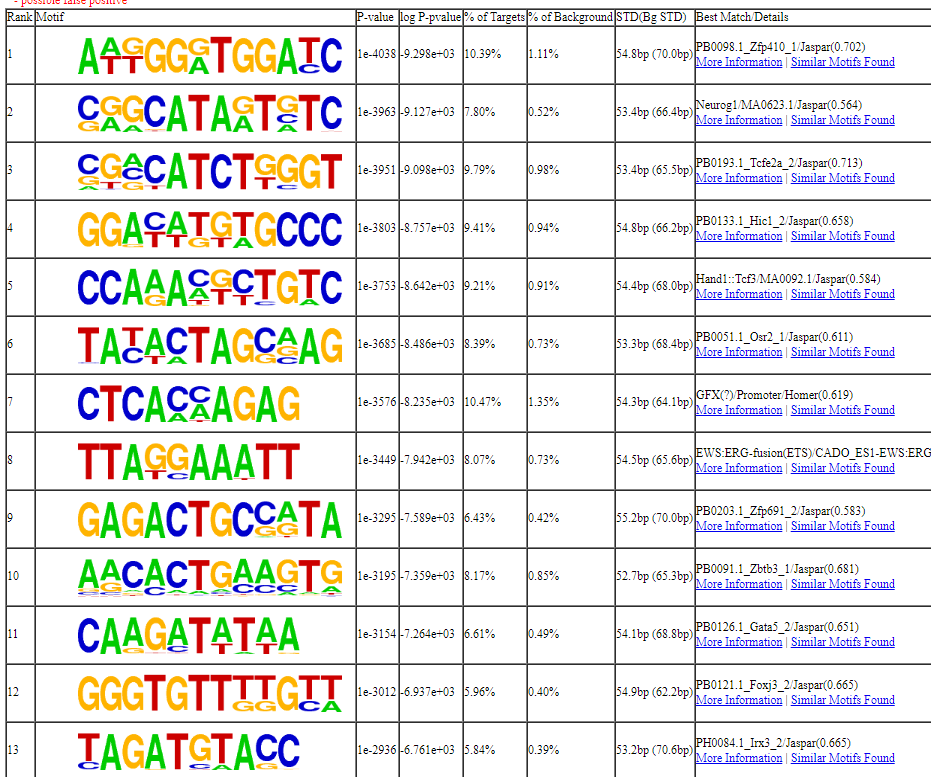
Table S4 part 1:List of enriched motifs in genomic regions found in an ATAC-seq sample using the HOMER tool
Licensed under: https://creativecommons.org/licenses/by/4.0/
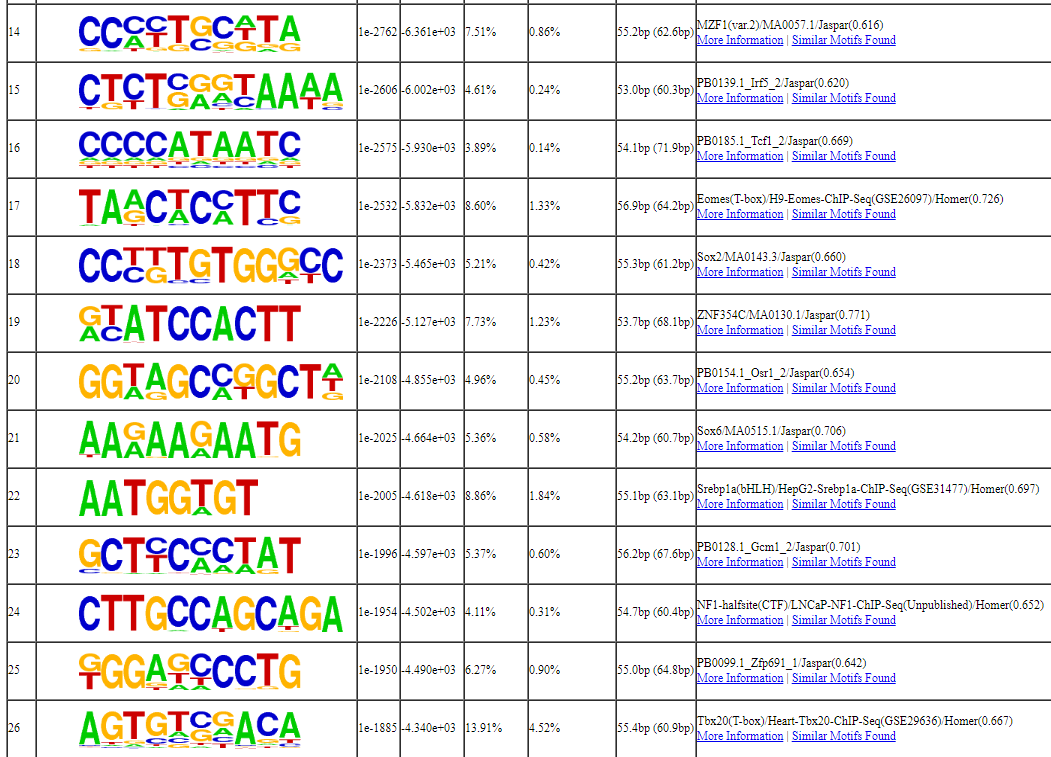
Table S4 part 2: List of enriched motifs in genomic regions found in an ATAC-seq sample using the HOMER tool
Licensed under: https://creativecommons.org/licenses/by/4.0/
Data set 3: Gel bead-in-emulsion Drop-seq data- SC Transcriptome Analysis of LβT2 Cells and Characterization of Early Gene Response to GnRH and Cell Cycle Dependence
Transcriptome: Other
Species
| Species |
|---|
| Mouse |
Tissue Types
| BRENDA tissue ontology | Maturity | Description | Species | Replicates |
|---|---|---|---|---|
| BTO_0000534: gonad | Adult | Mouse |
Cell Types
| Cell ontology | Maturity | Description | Species | Replicates | Cells per replicate |
|---|---|---|---|---|---|
| Adult | Mouse pituitary cell line (LßT2 cells) | Mouse | 3881 | ||
| Adult | LßT2- vehicle treated | Mouse | 1992 | ||
| Adult | LßT2- GnRH treated for 40 minutes | Mouse | 1889 |
Images
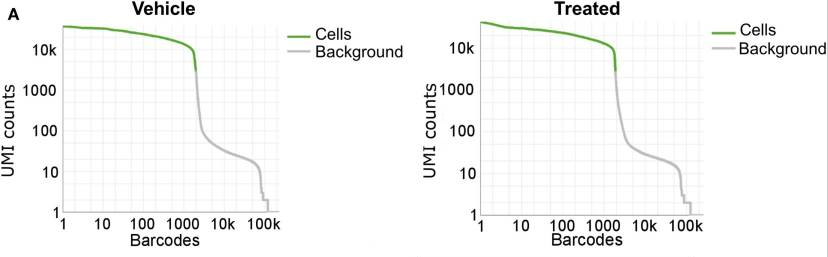
Figure 5 A: Gel bead-in-emulsion Drop-seq data-Drop-off of expression in unique molecular identifiers
Analysis of 3,881 LβT2 cells (1,992 vehicle-treated and 1,889 GnRH-treated cells for 40 min) having a median of 4,027 distinct genes quantified per cell from 380 million reads. Drop-off of expression in unique molecular identifiers (UMIs) counts for each cell (barcode), demonstrating even coverage.
Licensed under: https://creativecommons.org/licenses/by/4.0/
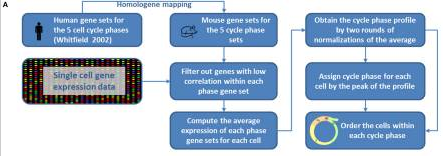
Figure 6 A: Flowchart diagram of the cell cycle analysis method
The score computation is based on the Supplemental Material from the study by Macosko et al. with the cell cycle genes taken from their Table S2 in Supplementary Material mapped to mouse gene using Homologene. The gene sets for the five cell cycle phases (G1/2, S, G2/M, M, and M/G1) were determined by comparing cells that were arrested at different cell cycle phases.
Licensed under: https://creativecommons.org/licenses/by/4.0/
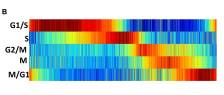
Figure 6 B: Each of the 3,881 (GnRH- and vehicle-treated) cells on the x-axis is aligned by the cell cycle progression
Each vertical line represents one cell with the color code indicating low (dark blue) to high (dark red) score assignment to the cell cycle phase. All cells are ranked by cell cycle progression according to the steps depicted in (A). The five cell cycle phases are indicated by the labels on the horizontal lines.
Licensed under: https://creativecommons.org/licenses/by/4.0/
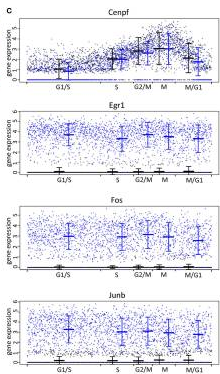
Figure 6 C: Single-cell expression of individual transcripts in relationship to cell cycle phase
Shown is the expression [log2 (TPM + 1)] of a gene associated with the mitotic (M) phase of cell cycle (Cenpf) and of GnRH-regulated genes (Egr1, Fos, and Junb). X-axis indicates cell cycle progression, as derived from (B). The mean and SD for vehicle- (in black) and GnRH-treated cells (in blue) are shown at each cell cycle phase. Note that the expression level of any gene in these cells at any point in the cell cycle can be accurately determined without experimental cell cycle synchronization.
Licensed under: https://creativecommons.org/licenses/by/4.0/