Genome-Wide Expression of Azoospermia Testes Demonstrates a Specific Profile and Implicates ART3 in Genetic Susceptibility
Hiroyuki Okada and Atsushi Tajima and Kazuyoshi Shichiri and Atsushi Tanaka and Kenichi Tanaka and Ituro Inoue, 08.02.2008
Abstract
Infertility affects about one in six couples attempting pregnancy, with the man responsible in approximately half of the cases. Because the pathophysiology underlying azoospermia is not elucidated, most male infertility is diagnosed as idiopathic. Genome-wide gene expression analyses with microarray on testis specimens from 47 non-obstructive azoospermia (NOA) and 11 obstructive azoospermia (OA) patients were performed, and 2,611 transcripts that preferentially included genes relevant to gametogenesis and reproduction according to Gene Ontology classification were found to be differentially expressed. Using a set of 945 of the 2,611 transcripts without missing data, NOA was further categorized into three classes using the non-negative matrix factorization method. Two of the three subclasses were different from the OA group in Johnsens score, FSH level, and/or LH level, while there were no significant differences between the other subclass and the OA group. In addition, the 52 genes showing high statistical difference between NOA subclasses (p < 0.01 with Tukeys post hoc test) were subjected to allelic association analyses to identify genetic susceptibilities. After two rounds of screening, SNPs of the ADP-ribosyltransferase 3 gene (ART3) were associated with NOA with highest significance with ART3-SNP25 (rs6836703; p = 0.0025) in 442 NOA patients and 475 fertile men. Haplotypes with five SNPs were constructed, and the most common haplotype was found to be under-represented in patients (NOA 26.6% versus control 35.3%, p = 0.000073). Individuals having the most common haplotype showed an elevated level of testosterone, suggesting a protective effect of the haplotype on spermatogenesis. Thus, genome-wide gene expression analyses were used to identify genes involved in the pathogenesis of NOA, and ART3 was subsequently identified as a susceptibility gene for NOA. These findings clarify the molecular pathophysiology of NOA and suggest a novel therapeutic target in the treatment of NOA.
OKADA, Hiroyuki, et al. Genome-wide expression of azoospermia testes demonstrates a specific profile and implicates ART3 in genetic susceptibility. PLoS genetics, 2008, 4. Jg., Nr. 2, S. e26.
Publication: https://doi.org/10.1371/journal.pgen.0040026
 Disclaimer
The publication Genome-Wide Expression of Azoospermia Testes Demonstrates a Specific Profile and Implicates ART3 in Genetic Susceptibility by Hiroyuki Okada and Atsushi Tajima and Kazuyoshi Shichiri and Atsushi Tanaka and Kenichi Tanaka and Ituro Inoue is published under an open access no derivatives license: : https://creativecommons.org/. Open-access article distributed under the terms of the Creative Commons Attribution License, which permits unrestricted use, distribution, and reproduction in any medium, provided the original author and source are credited.
Curation by the MFGA team Relevant data sets presented in the publication have been identified. If possible, annotations (title, general information, conditions, processed tissue types and processed cell types) have been added based on information from the publication. Data tables and images that provide a good overview on the publication's findings on the data set have been extracted from the publication and/or supplement. If not stated otherwise, images are depicted with title and description exactly as in the publication. Tables have been adjusted to the MFGA table format. Conducted adjustments are explained in the detailed view of the tables. However, titles and descriptions have been adopted from the publication.
Data set 1: Study 1
Exome: Microarray
Species
| Species |
|---|
| human |
Conditions
| Human phenotype ontology | Participants | Comment |
|---|---|---|
| HP:0011961: Non-obstructive azoospermia | 47 | |
| HP:0011962: Obstructive azoospermia | 11 |
Images
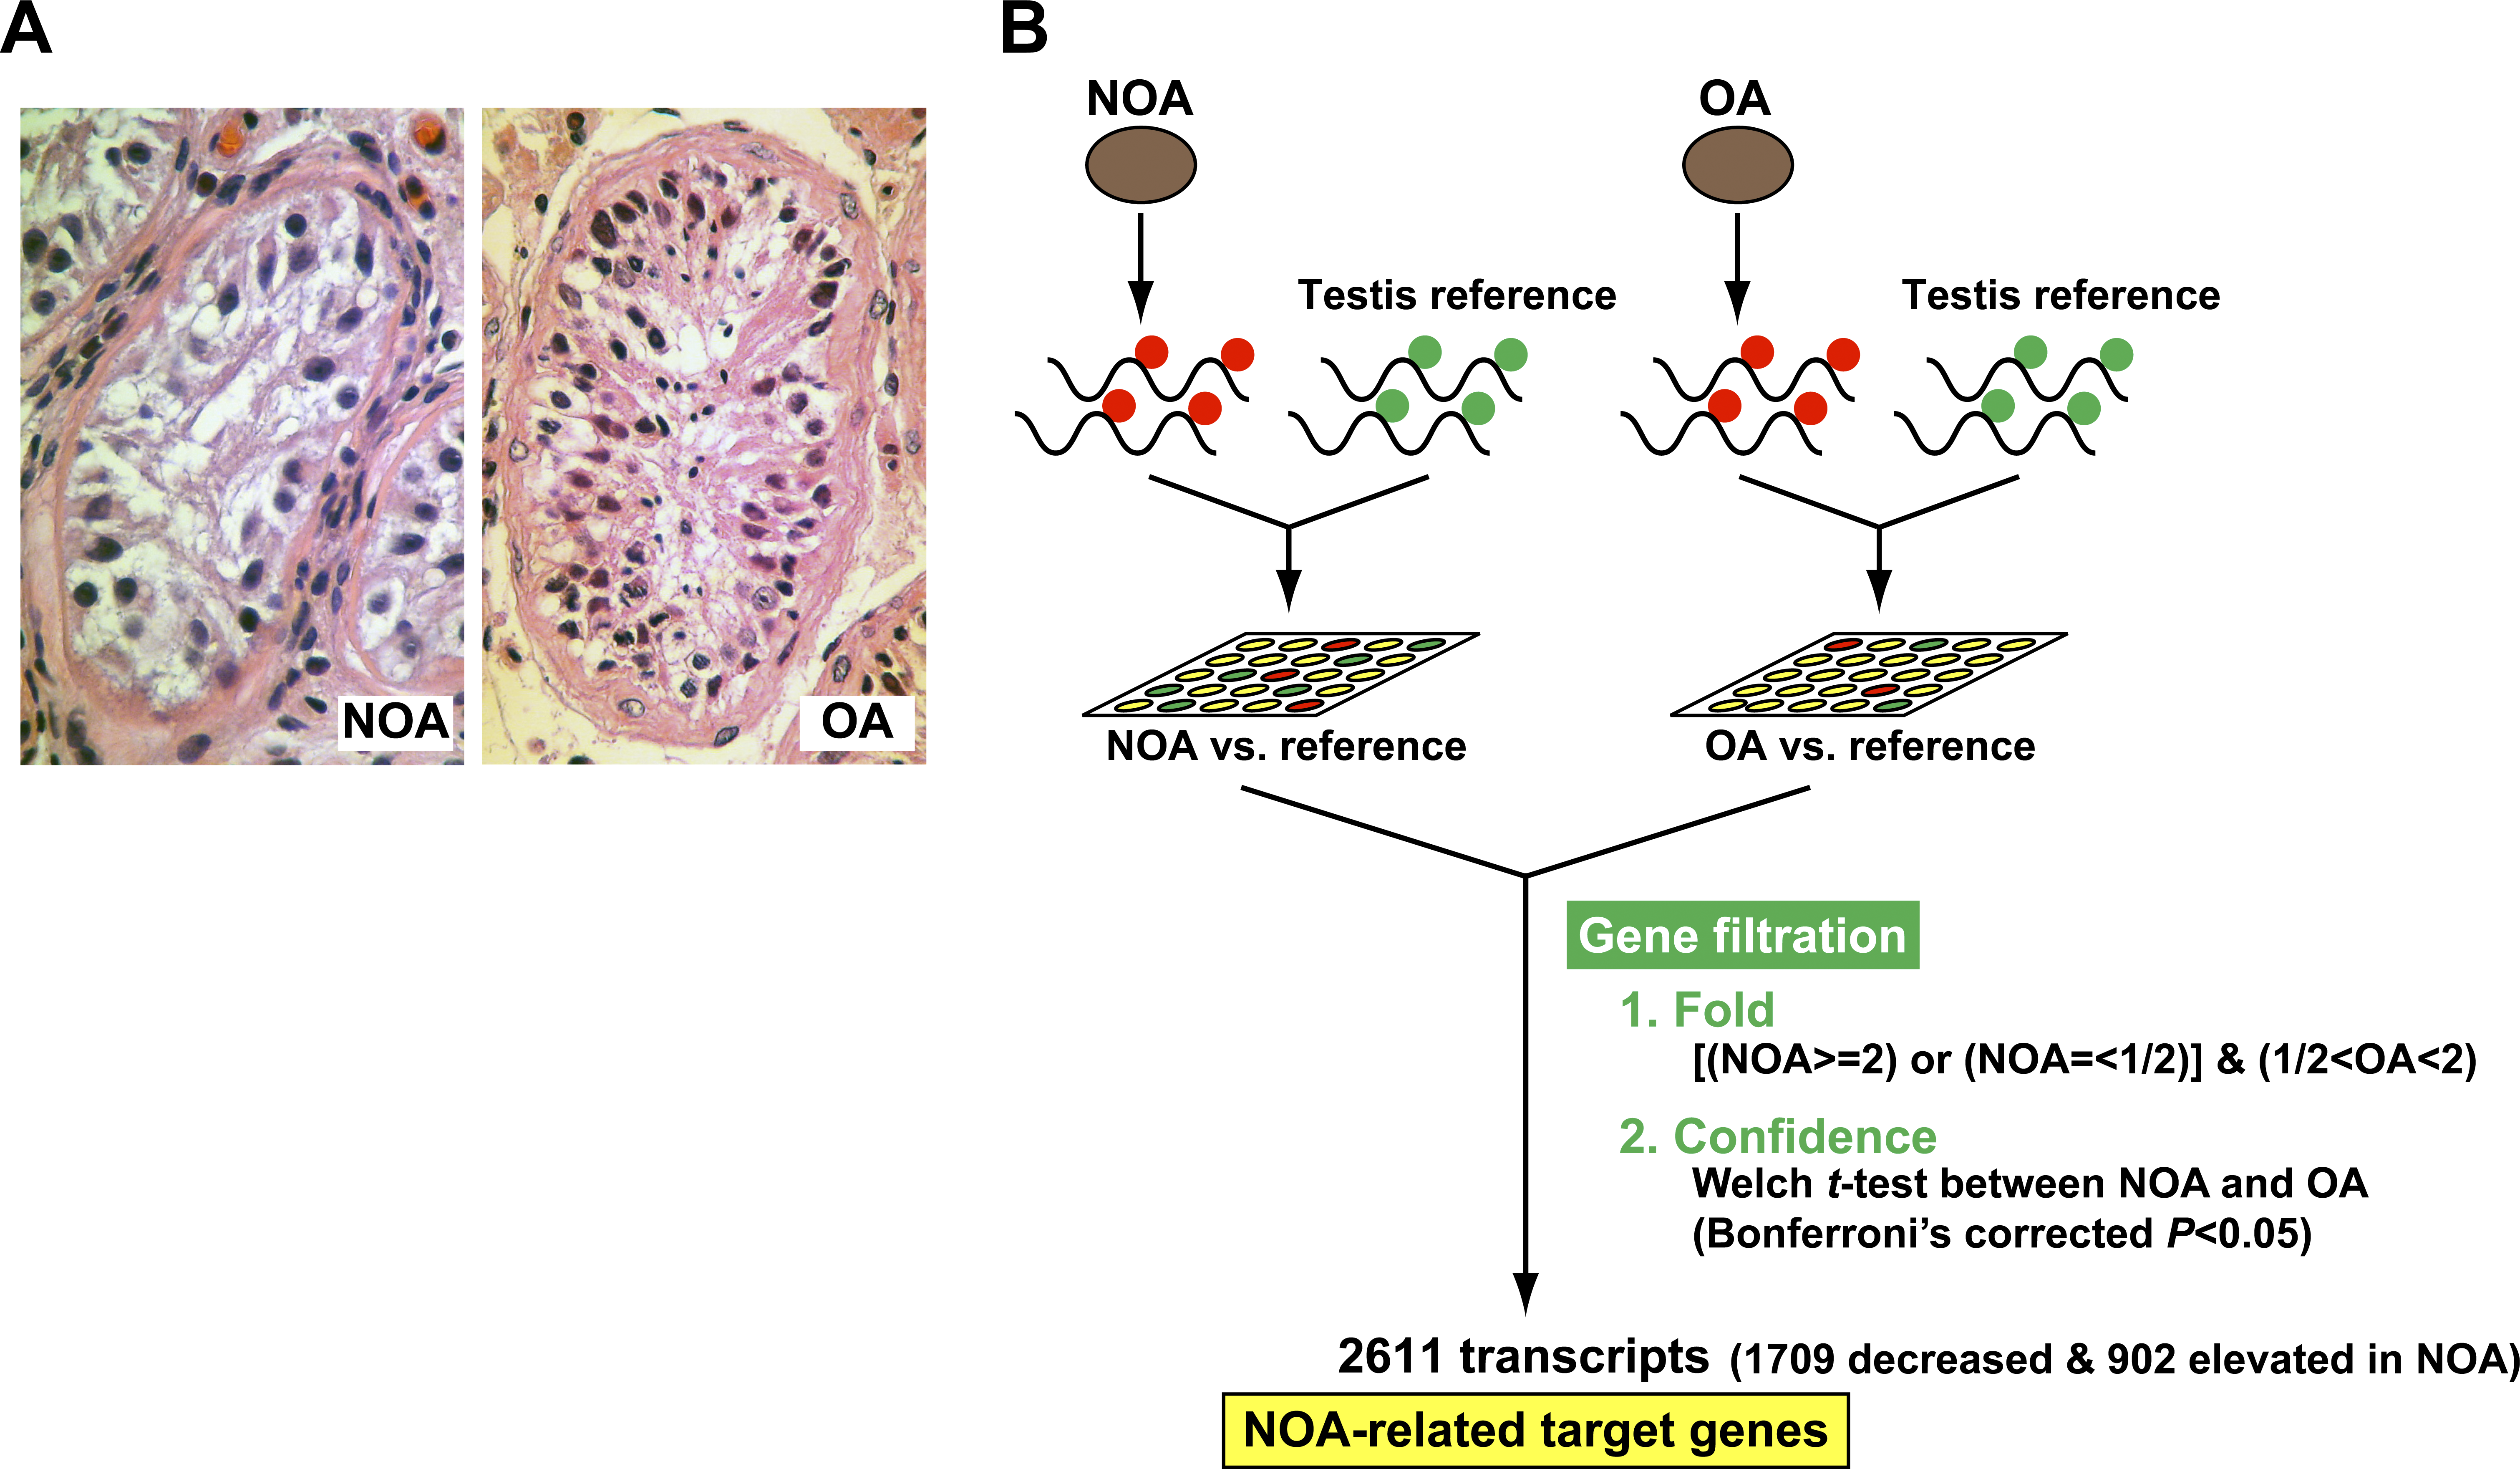
Figure 1: Experimental Design to Extract NOA-related Target Genes
(A) Representative testicular biopsies from NOA (left panel) and OA (right panel) patients. The seminiferous tubules in NOA testis show Sertoli cells only; testicular histology of the OA patient indicates the presence of germ cells at all stages of spermatogenesis.</br>(B) Strategy for discovering the NOA-specific expression profile, i.e., the NOA-related target genes. Compared with the expression level of reference RNA, the NOA group, with expression undergoing 2-fold or more mean change, was extracted; the OA group comprised transcripts with less than 2-fold mean expression change. Of the overlapping transcripts, only those with statistically significant difference between NOA and OA (p , 0.05 with Bonferroni’s correction) were identified as differentially expressed.</br>doi:10.1371/journal.pgen.0040026.g001
Licensed under: https://creativecommons.org/
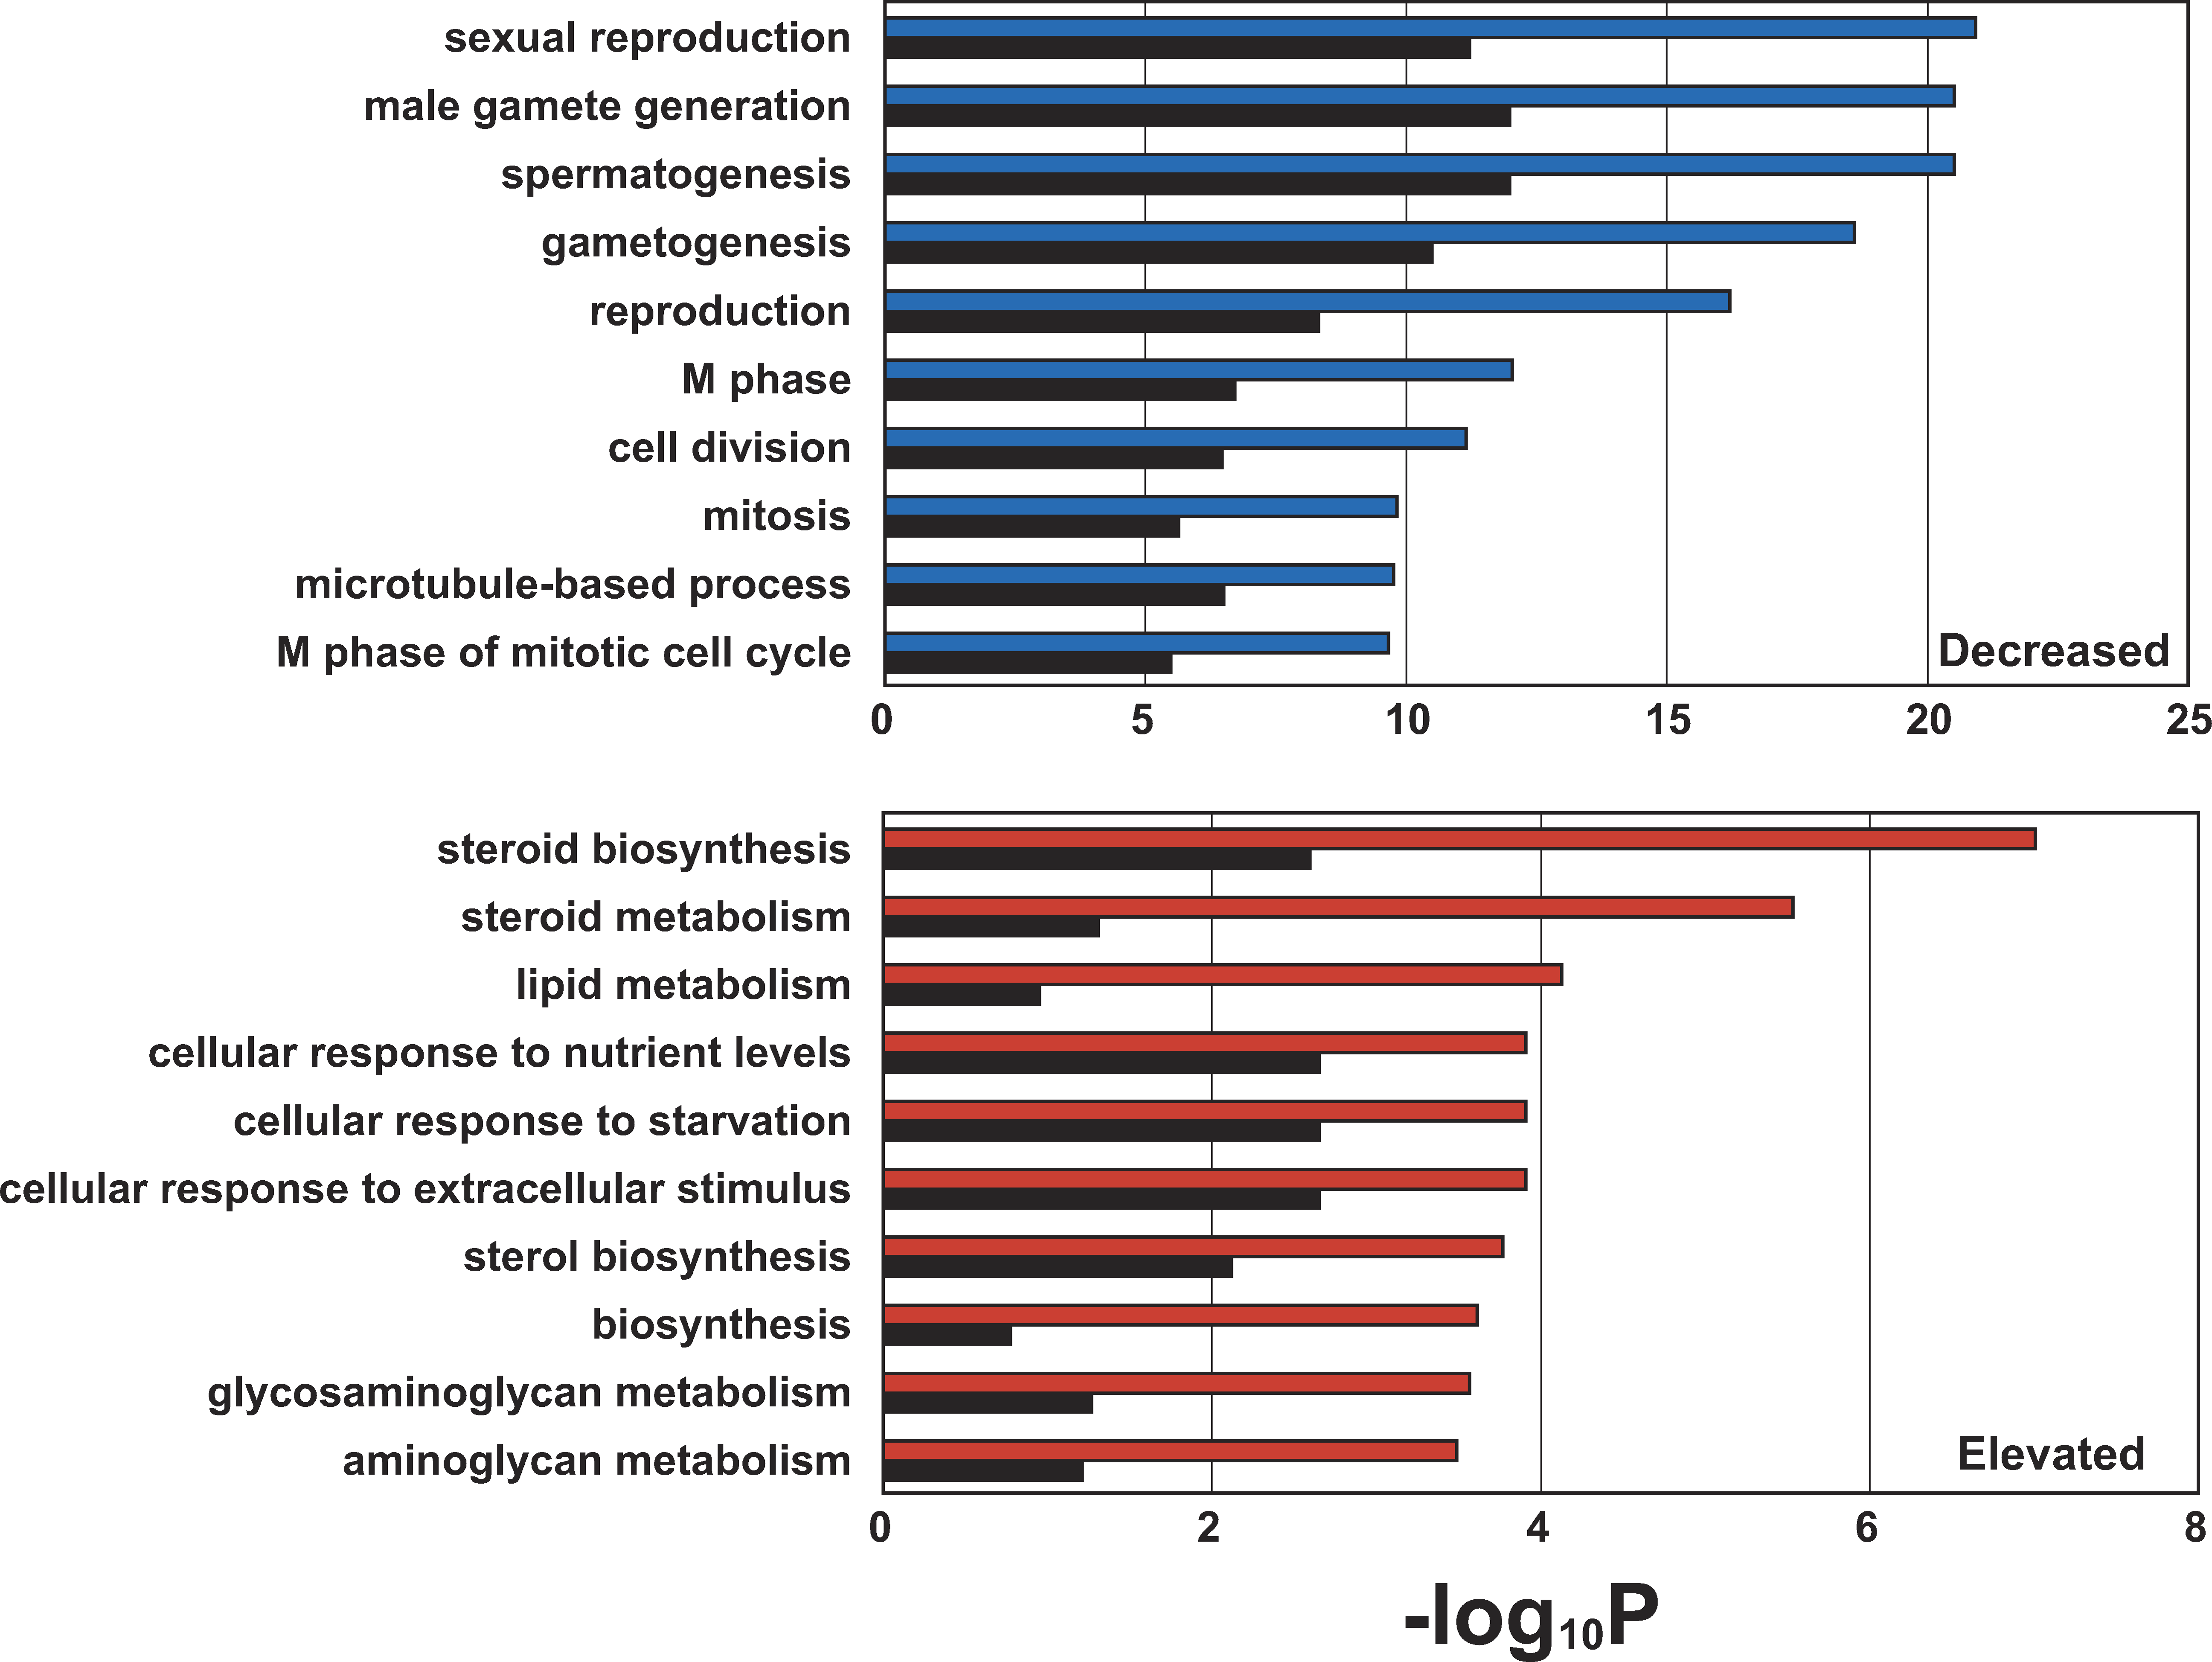
Figure 2: Comparison of Ten Top-ranked Gene Ontology (GO) Categories Significantly Over-Represented in the Two Subsets (1,709 Decreased, UpperPanel; 903 Elevated, Lower Panel) of NOA-related Target Genes
Blue and red bars represent p-values for the ten top-ranked GO categories over-represented in the decreased and elevated gene lists, respectively. Blackbars show the corresponding p-value using 2,611 NOA-related target genes. p-Values were determined by Fisher’s exact test using all of the GO-annotated genes on the Agilent Human 1A(v2) microarray as a background, as shown in Table 1. The p-values are expressed as the negative logarithm(base 10).</br>doi:10.1371/journal.pgen.0040026.g002
Licensed under: https://creativecommons.org/
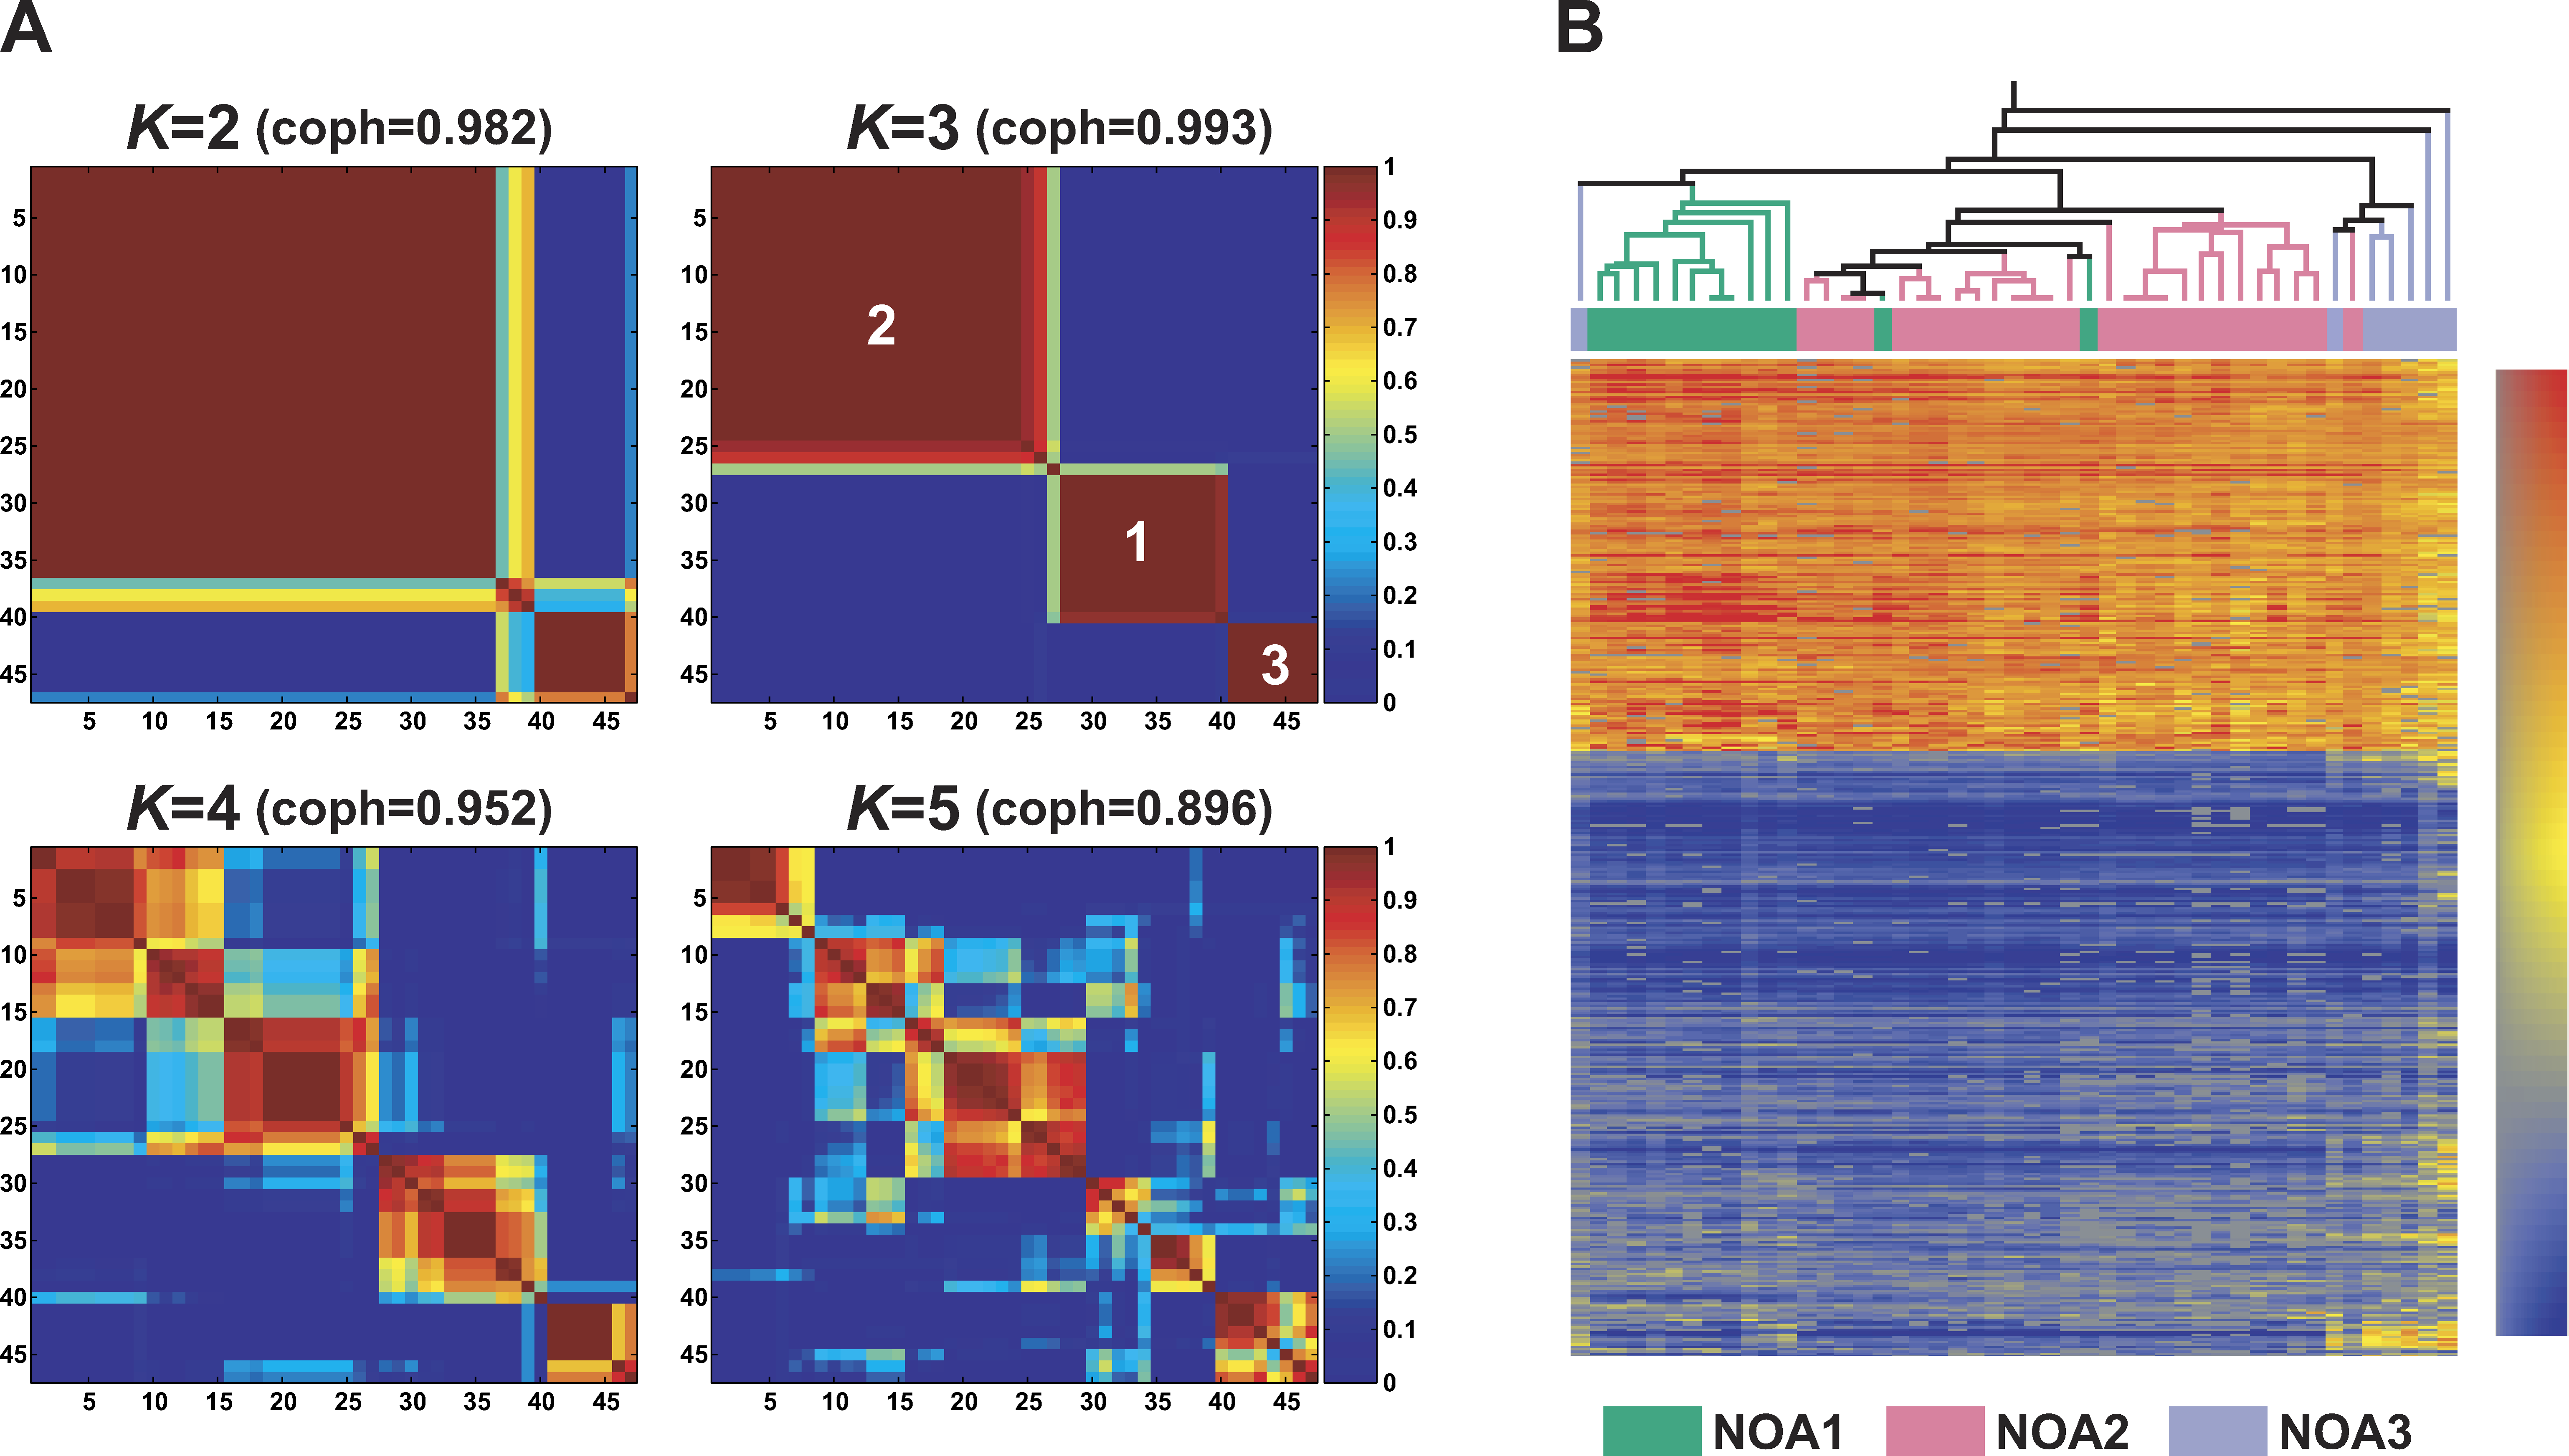
Figure 3: Non-Negative Matrix Factorization (NMF) and Hierarchical Clustering (HC)-based Subclassification of 47 NOA Samples
(A) Reordered consensus matrices averaging 50 connectivity matrices computed at K 1⁄4 2–5 (as the number of subclasses modeled) for the NOA data setcomprising of NOA-related target genes. NMF computation and model selection were performed according to Brunet et al. [6] as described in Materialsand Methods. According to cophenetic correlation coefficients (coph) for NMF-clustered matrices, the NMF class assignment for K 1⁄4 3 was the mostrobust.</br>(B) The HC method incorporated in GeneSpring also was used to classify NOA heterogeneity in testicular gene expression. To display correspondencesof subclassification by the two methods, the NMF class assignments for K 1⁄4 3 are shown color-coded; NOA1 (green), NOA2 (pink), and NOA3 (lightpurple).</br>doi:10.1371/journal.pgen.0040026.g003
Licensed under: https://creativecommons.org/
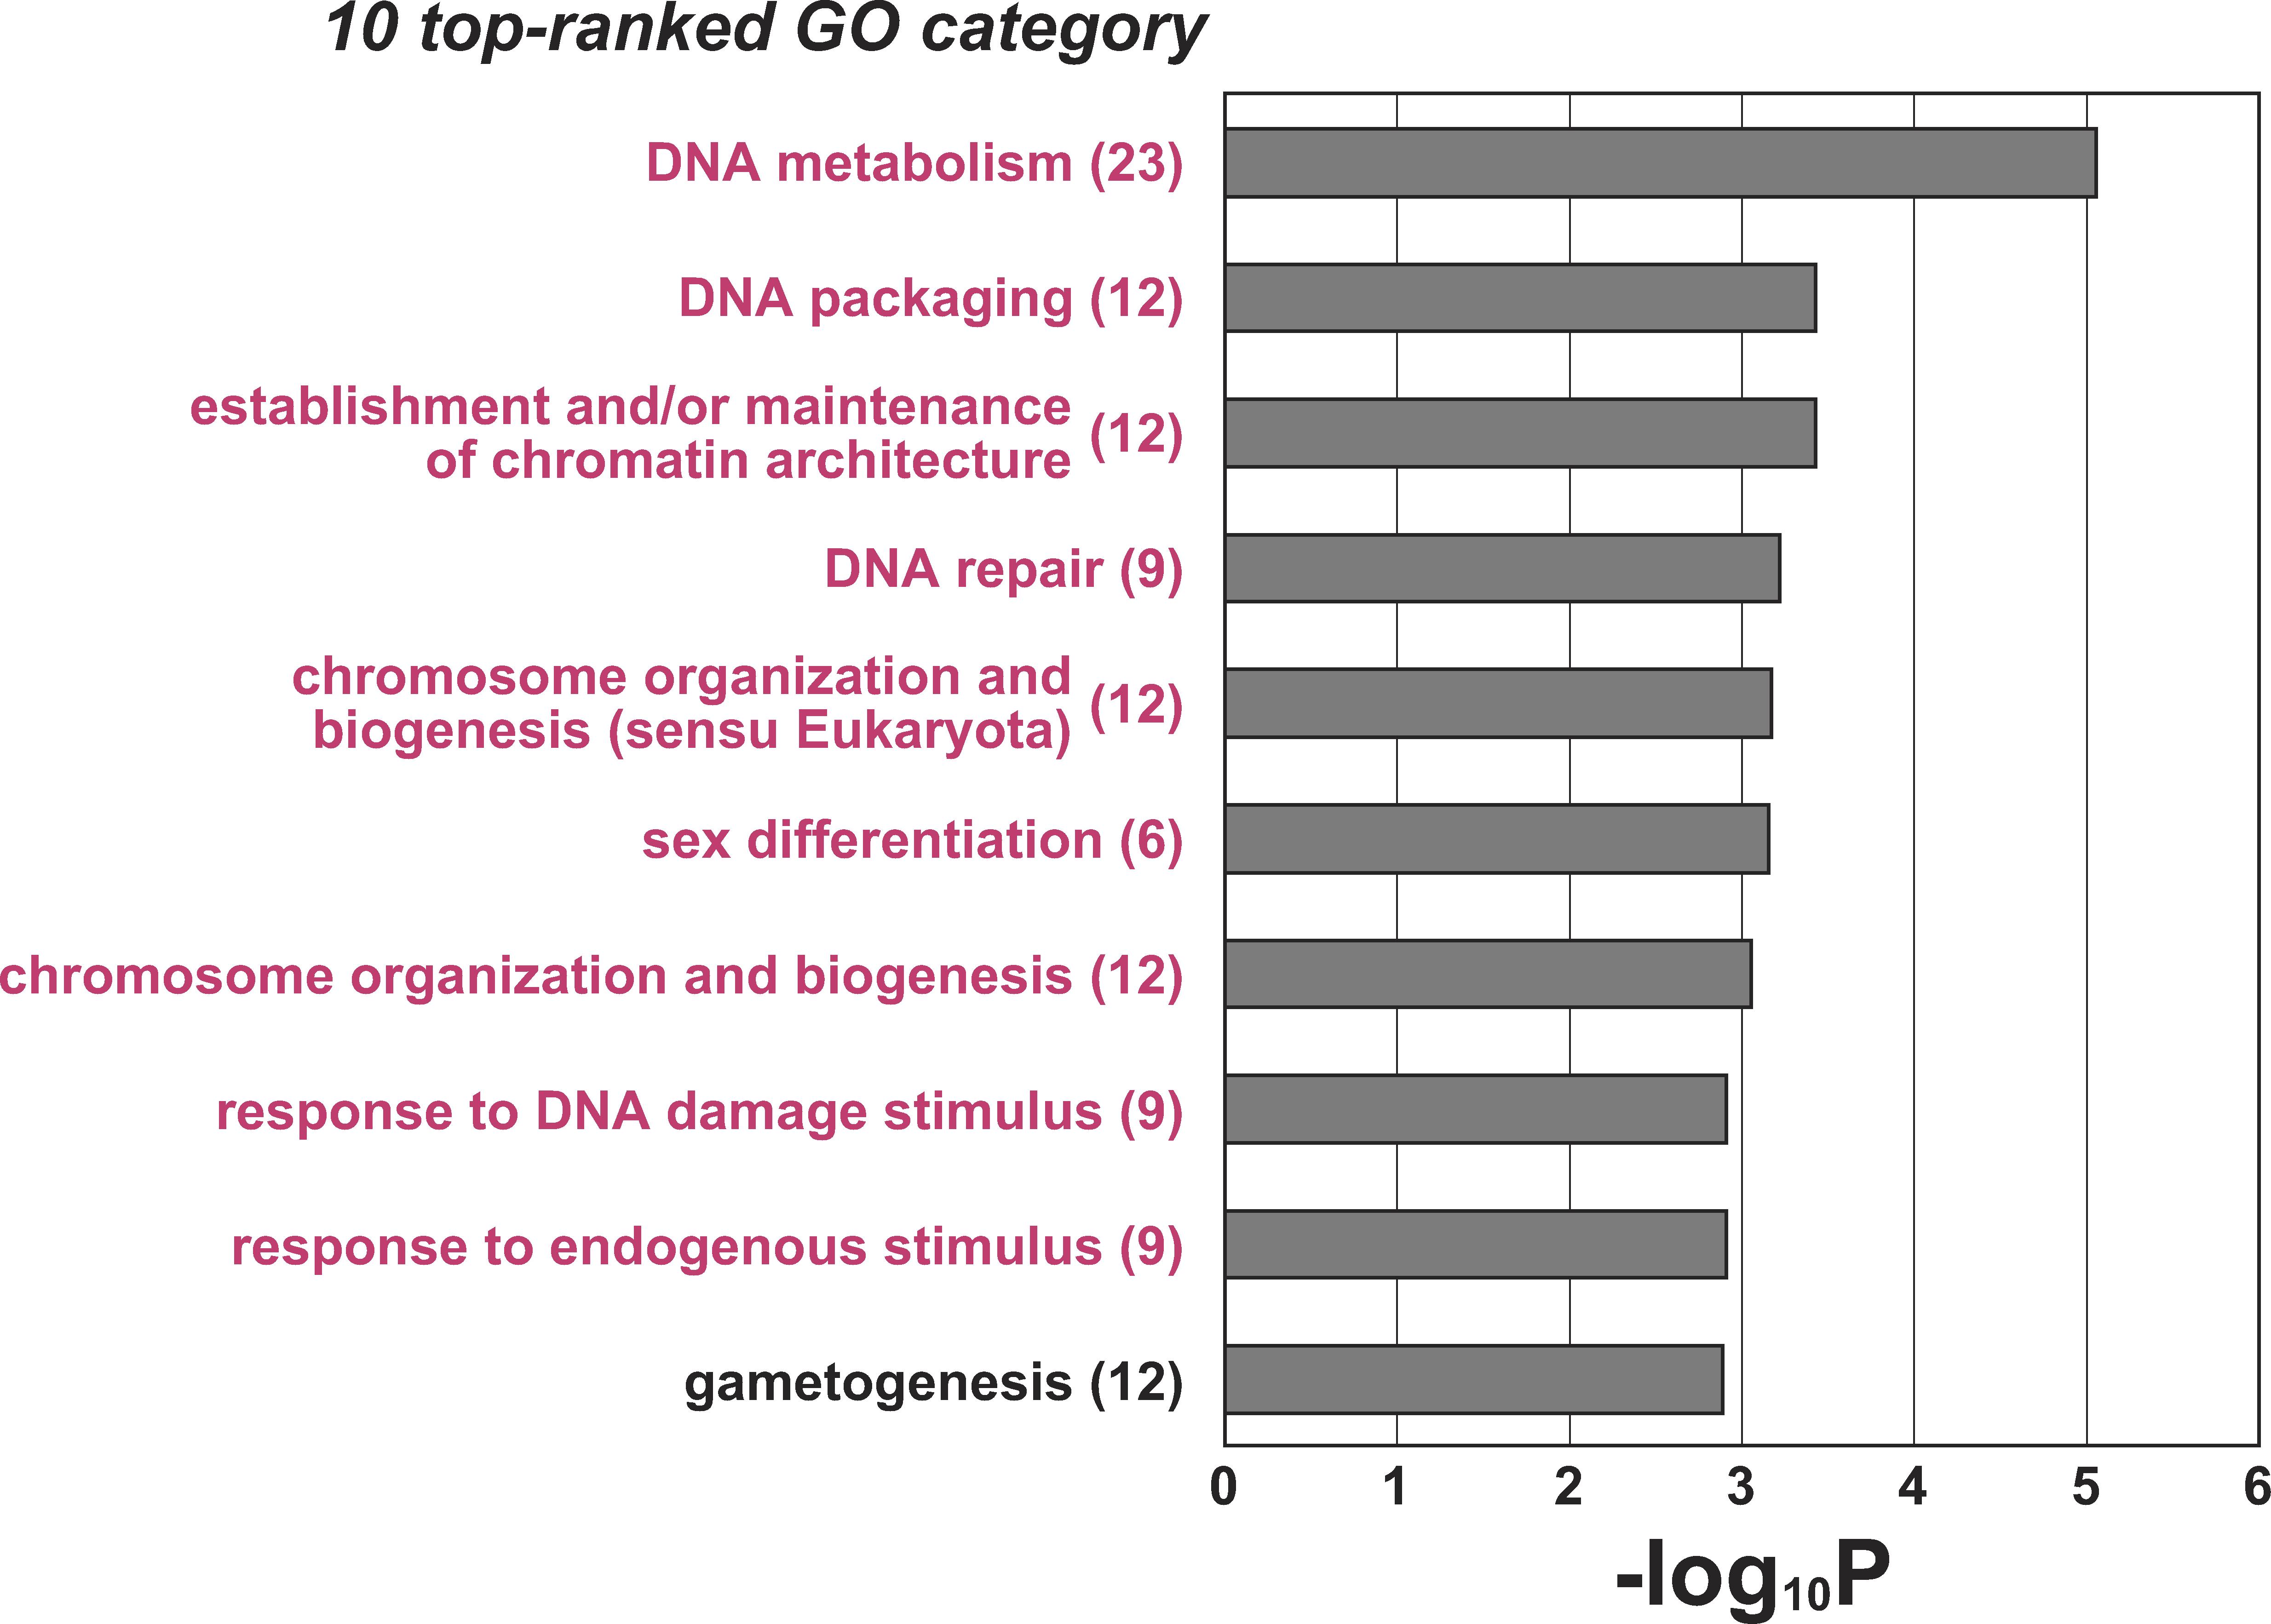
Figure 4: Significant Enrichments of Gene Ontology Categories in GO-based Profiling of 149 Differentially Expressed Transcripts
Grey bars represent p-values (expressed as the negative logarithm [base 10]) for the 10 top-ranked GO categories over-represented in the 149differentially expressed transcripts, using the 2,611 NOA-related target transcripts as a background set of genes for the determination of p-values. Theactual number of differentially expressed transcripts involved in each category is given in parentheses. In the process of extracting the 149 transcriptsfrom the NOA-related target gene list, sets of genes involved in nine GO categories, marked in magenta, were more condensed because they were notfound in the previous 10 top-ranked GO lists of NOA-related target genes (see Table 1 and Figure 2).</br> doi:10.1371/journal.pgen.0040026.g004
Licensed under: https://creativecommons.org/
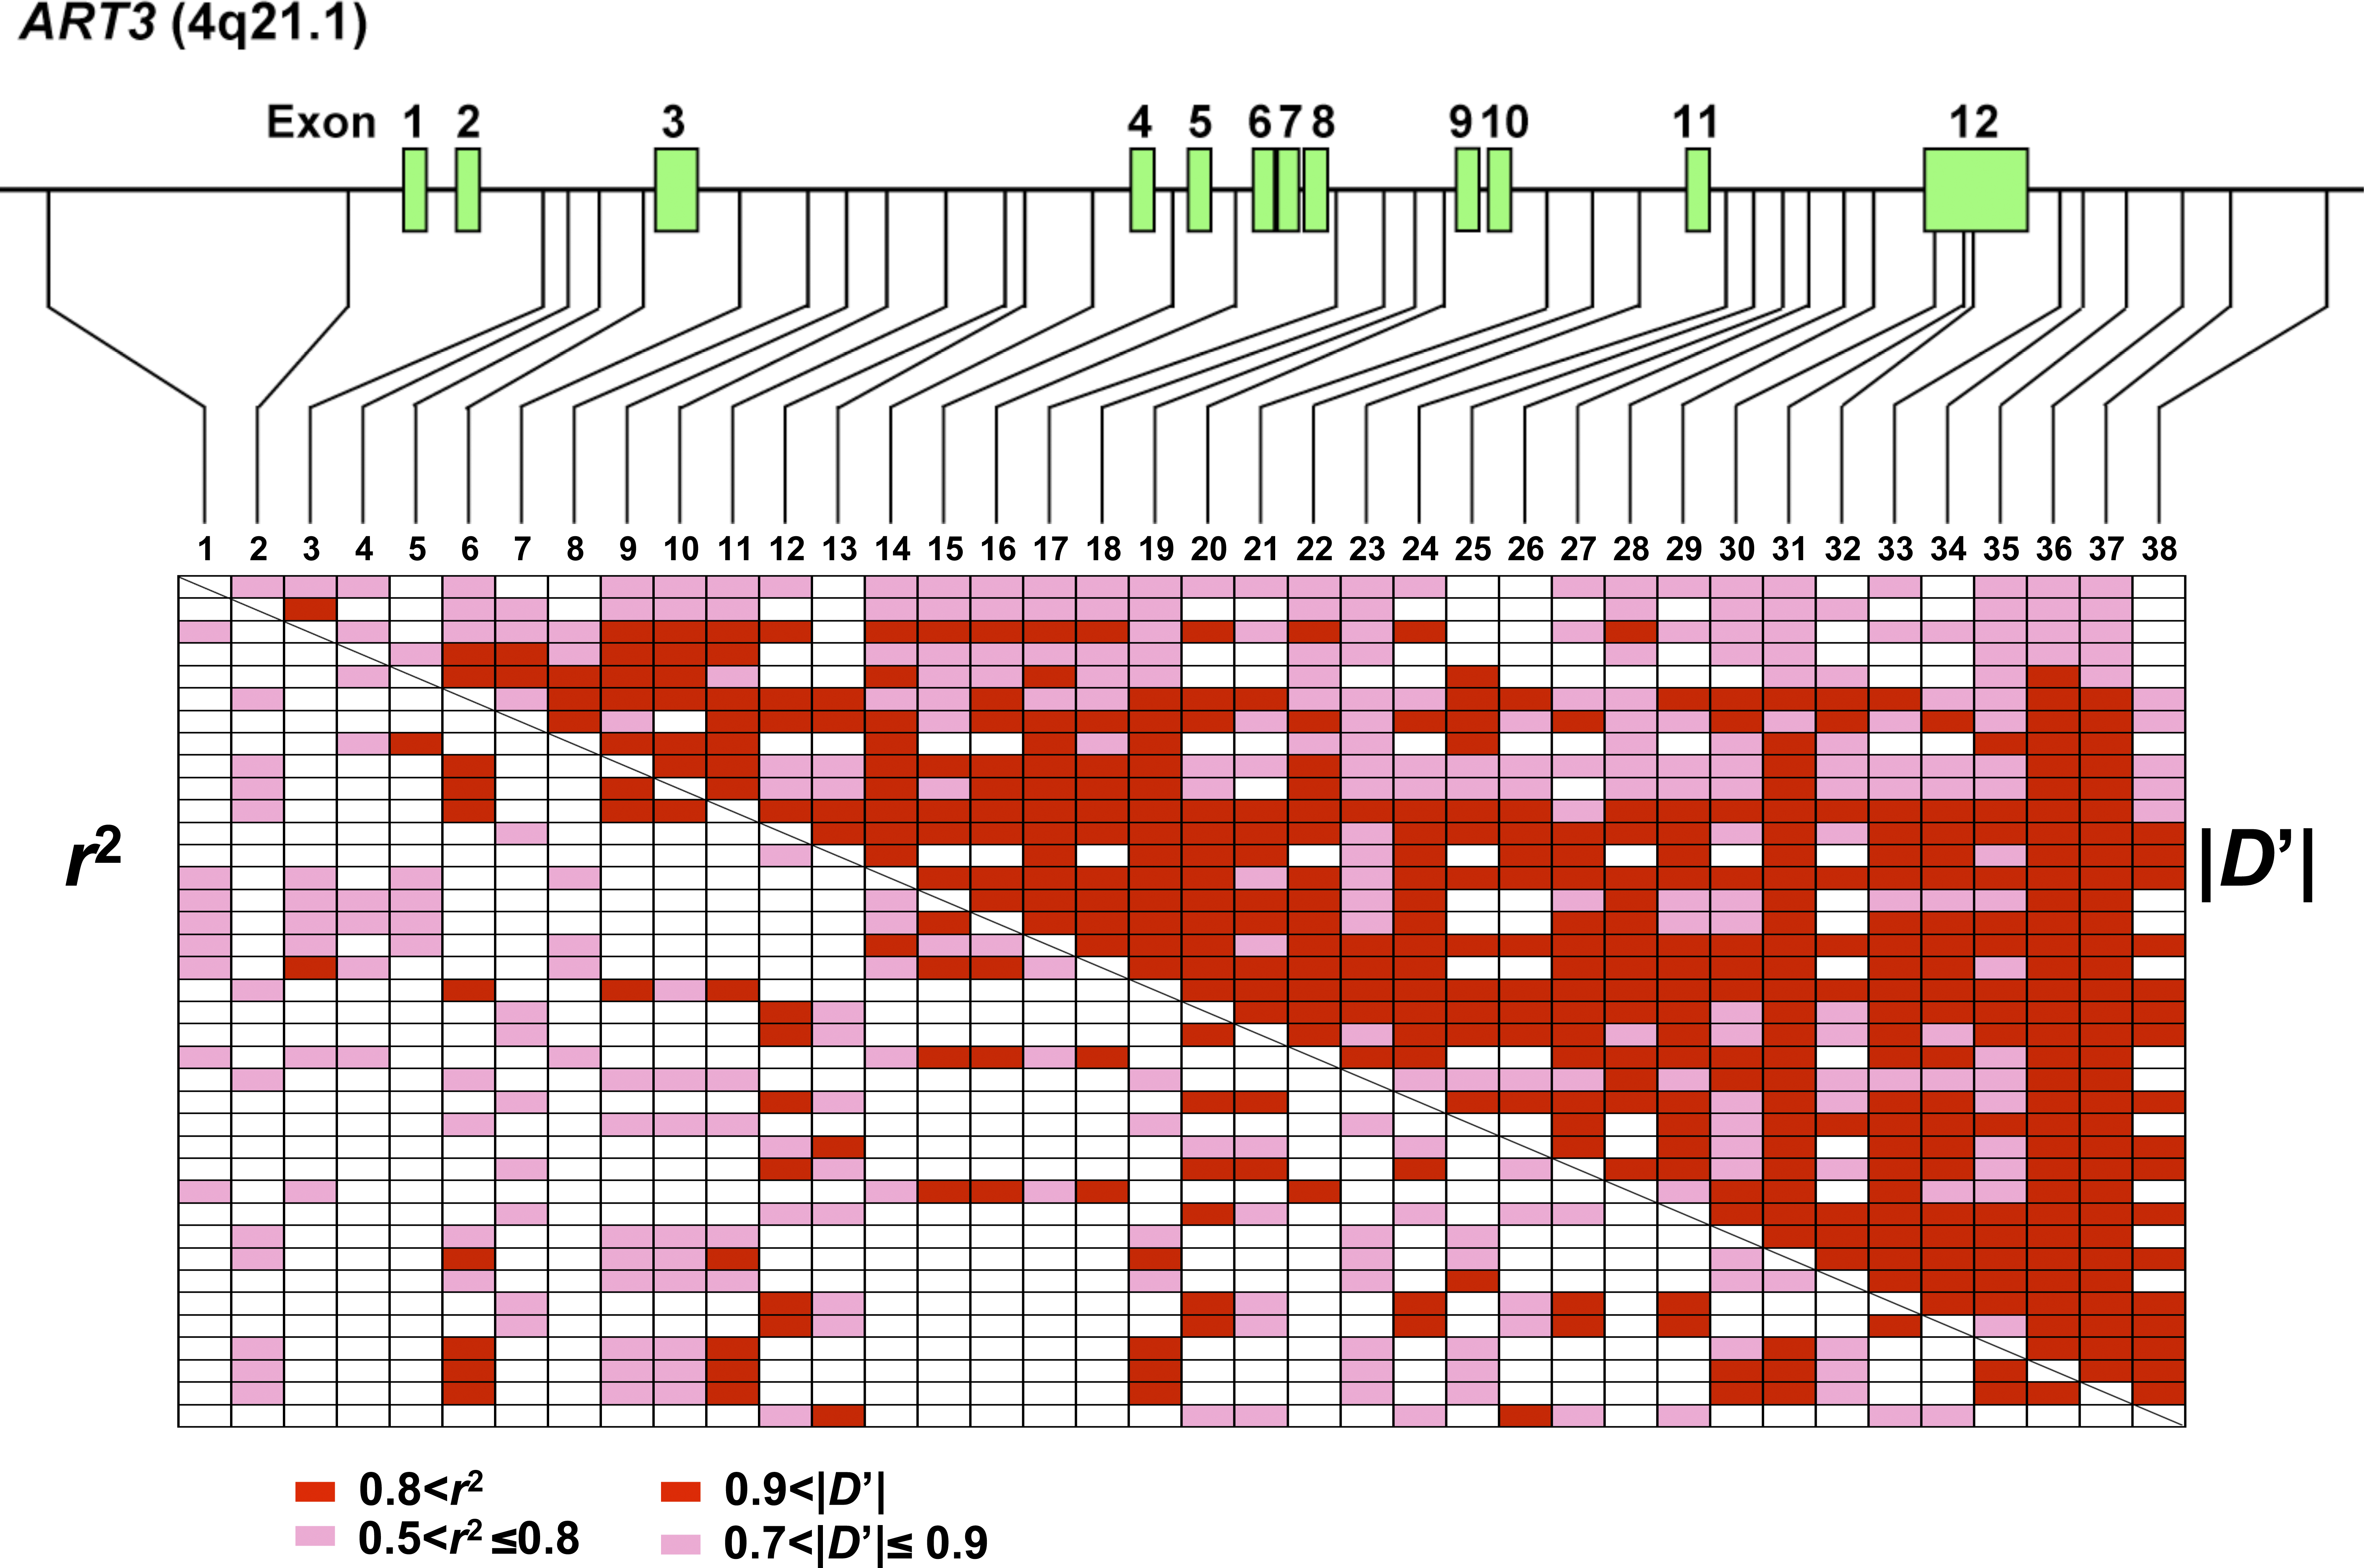
Figure 5: Linkage Disequilibrium Pattern of ART3
The gene structure together with the position of 38 SNPs is shown. Pairwise LD coefficients, D’ and r^2 , of controls were determined and expressed as ablock structure. In the schematic block, red boxes indicate pairwise LD of ID’I > 0.9 or r^2 > 0.8 and pink boxes 0.9 >= ID’I > 0.7 or 0.8 <= r^2 > 0.5. Blankboxes represent ID’I <= 0.7 or r^2 <= 0.5. </br>doi:10.1371/journal.pgen.0040026.g005
Licensed under: https://creativecommons.org/
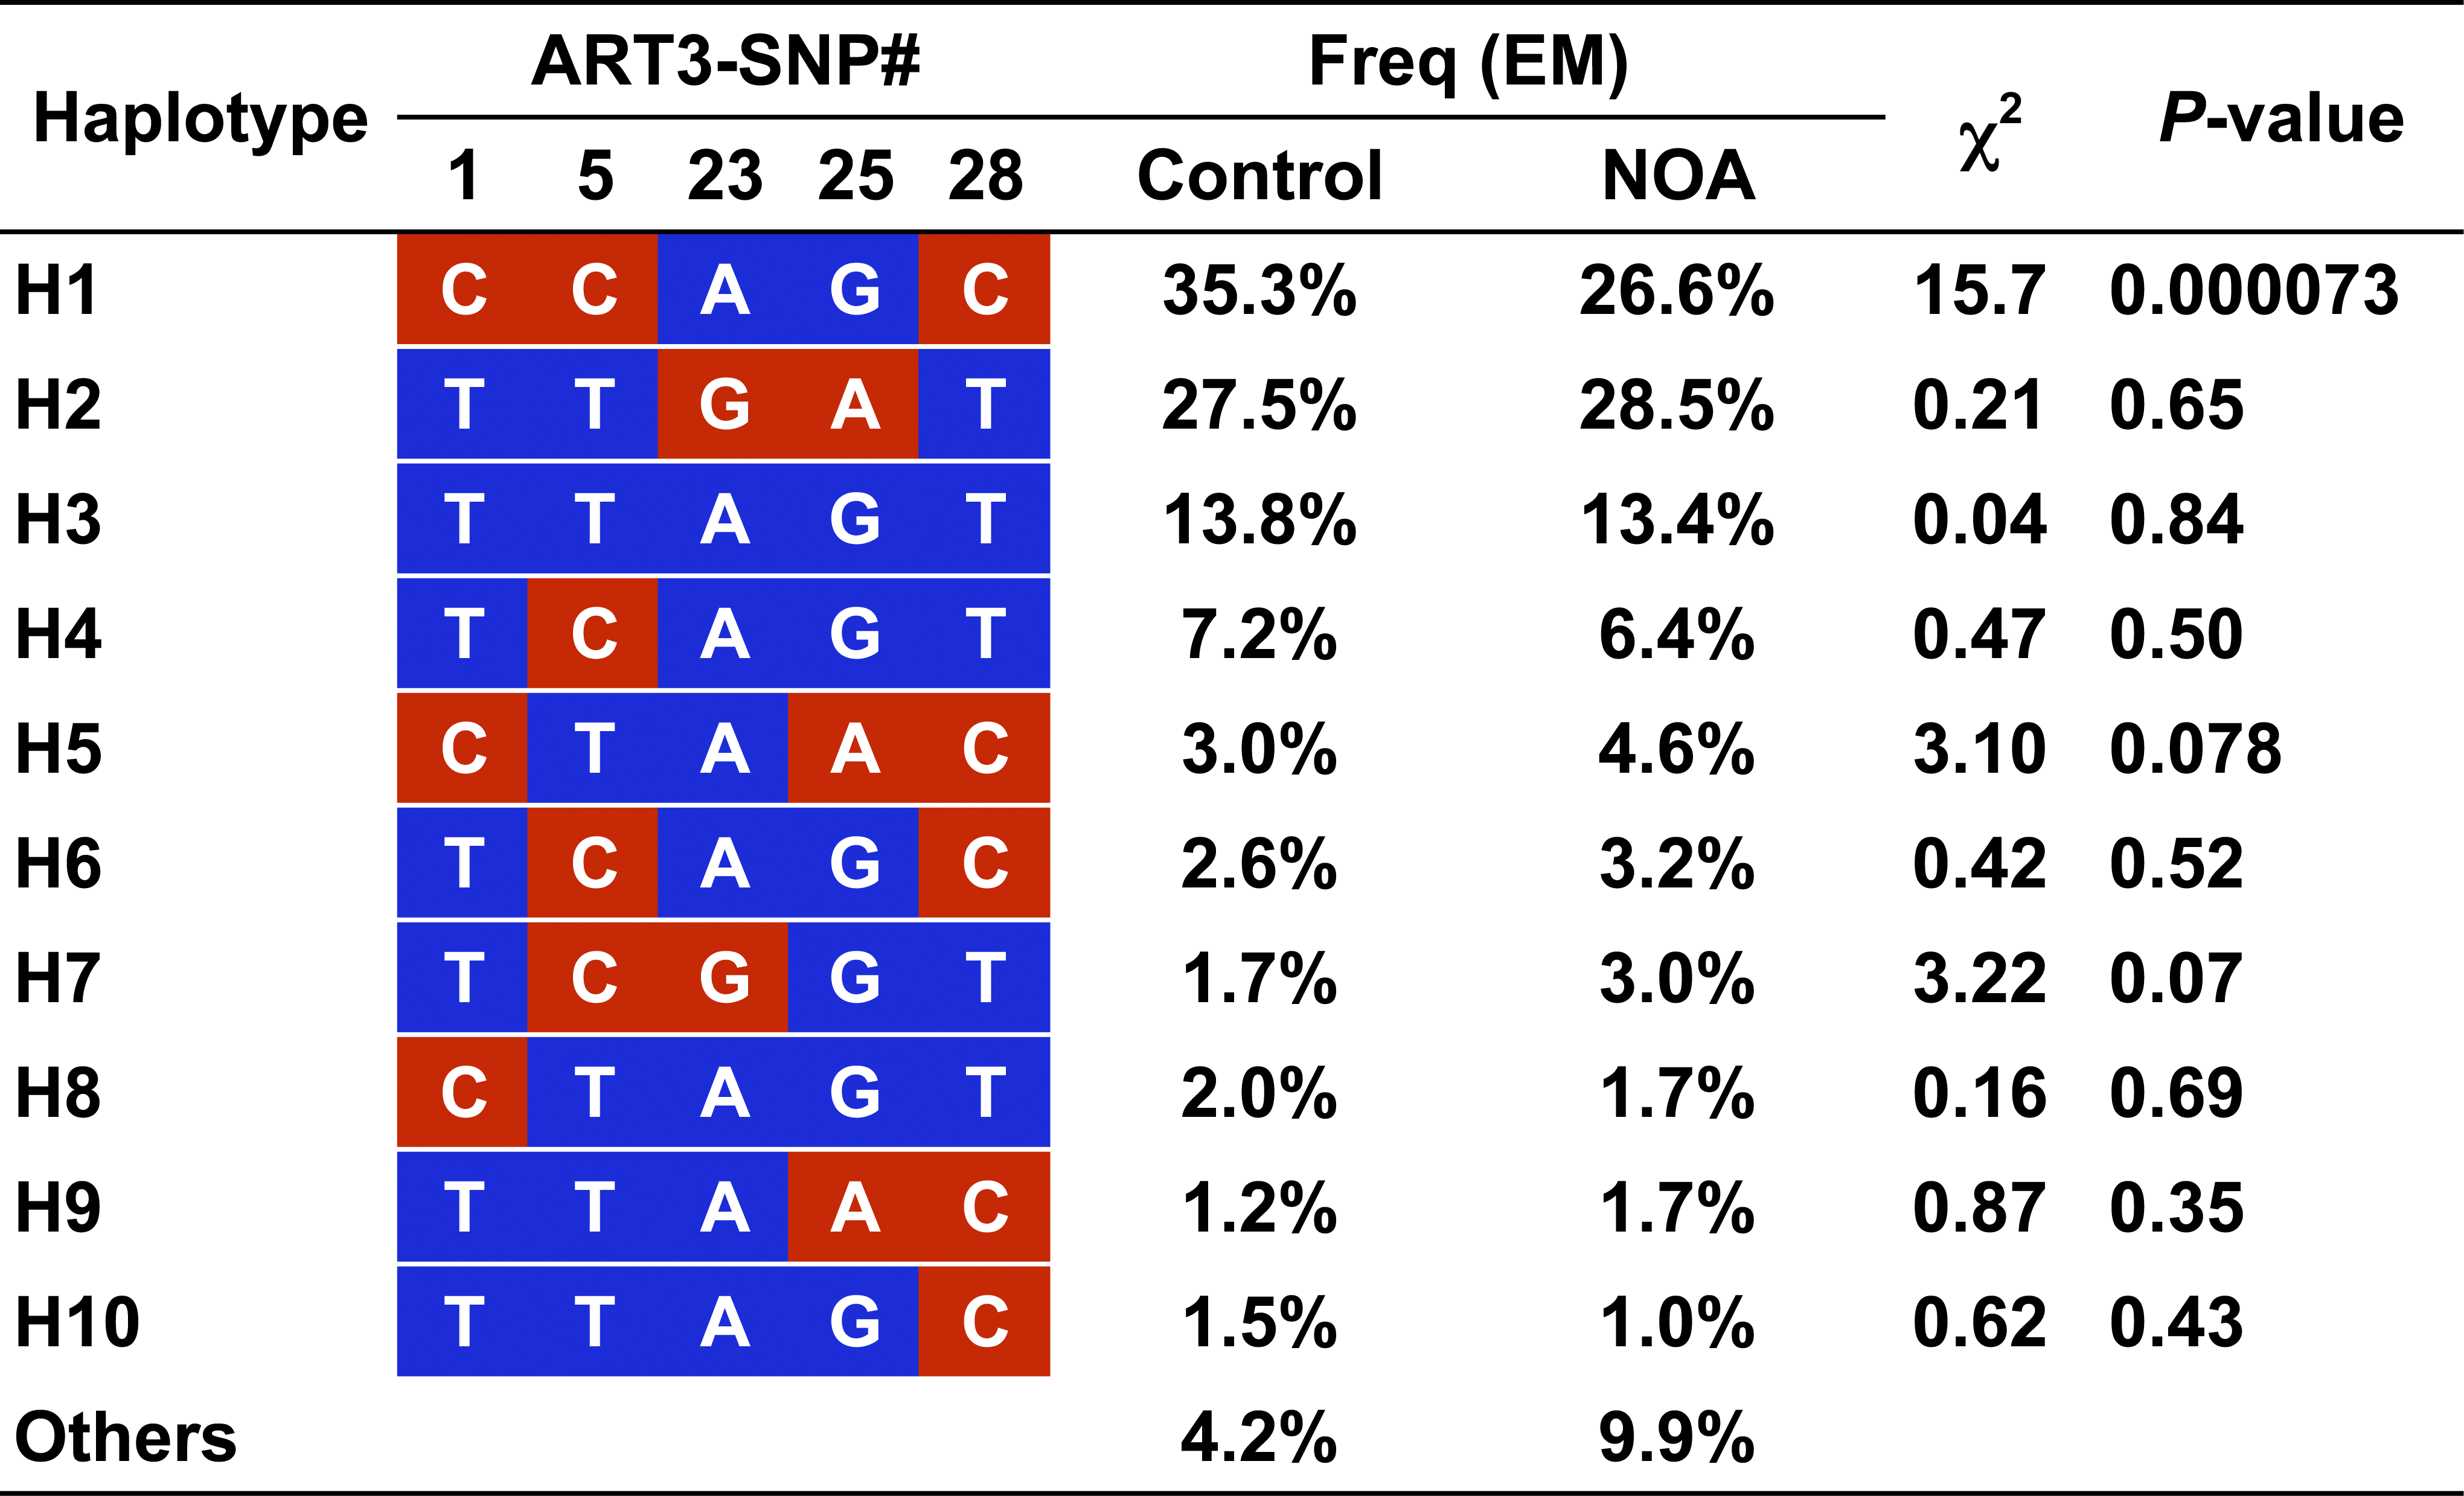
Figure 6: Haplotype-based Association Study of ART3
The expectation-maximization (EM) algorithm [37] was used to infer ART3haplotype frequencies with genotyping data of five tag SNPs, ART3-SNP1, 5, 8, 23, 25, and 28 (see Table 4). At the respective SNP sites, redand blue boxes represent minor and major alleles, respectively. </br>doi:10.1371/journal.pgen.0040026.g006
Licensed under: https://creativecommons.org/
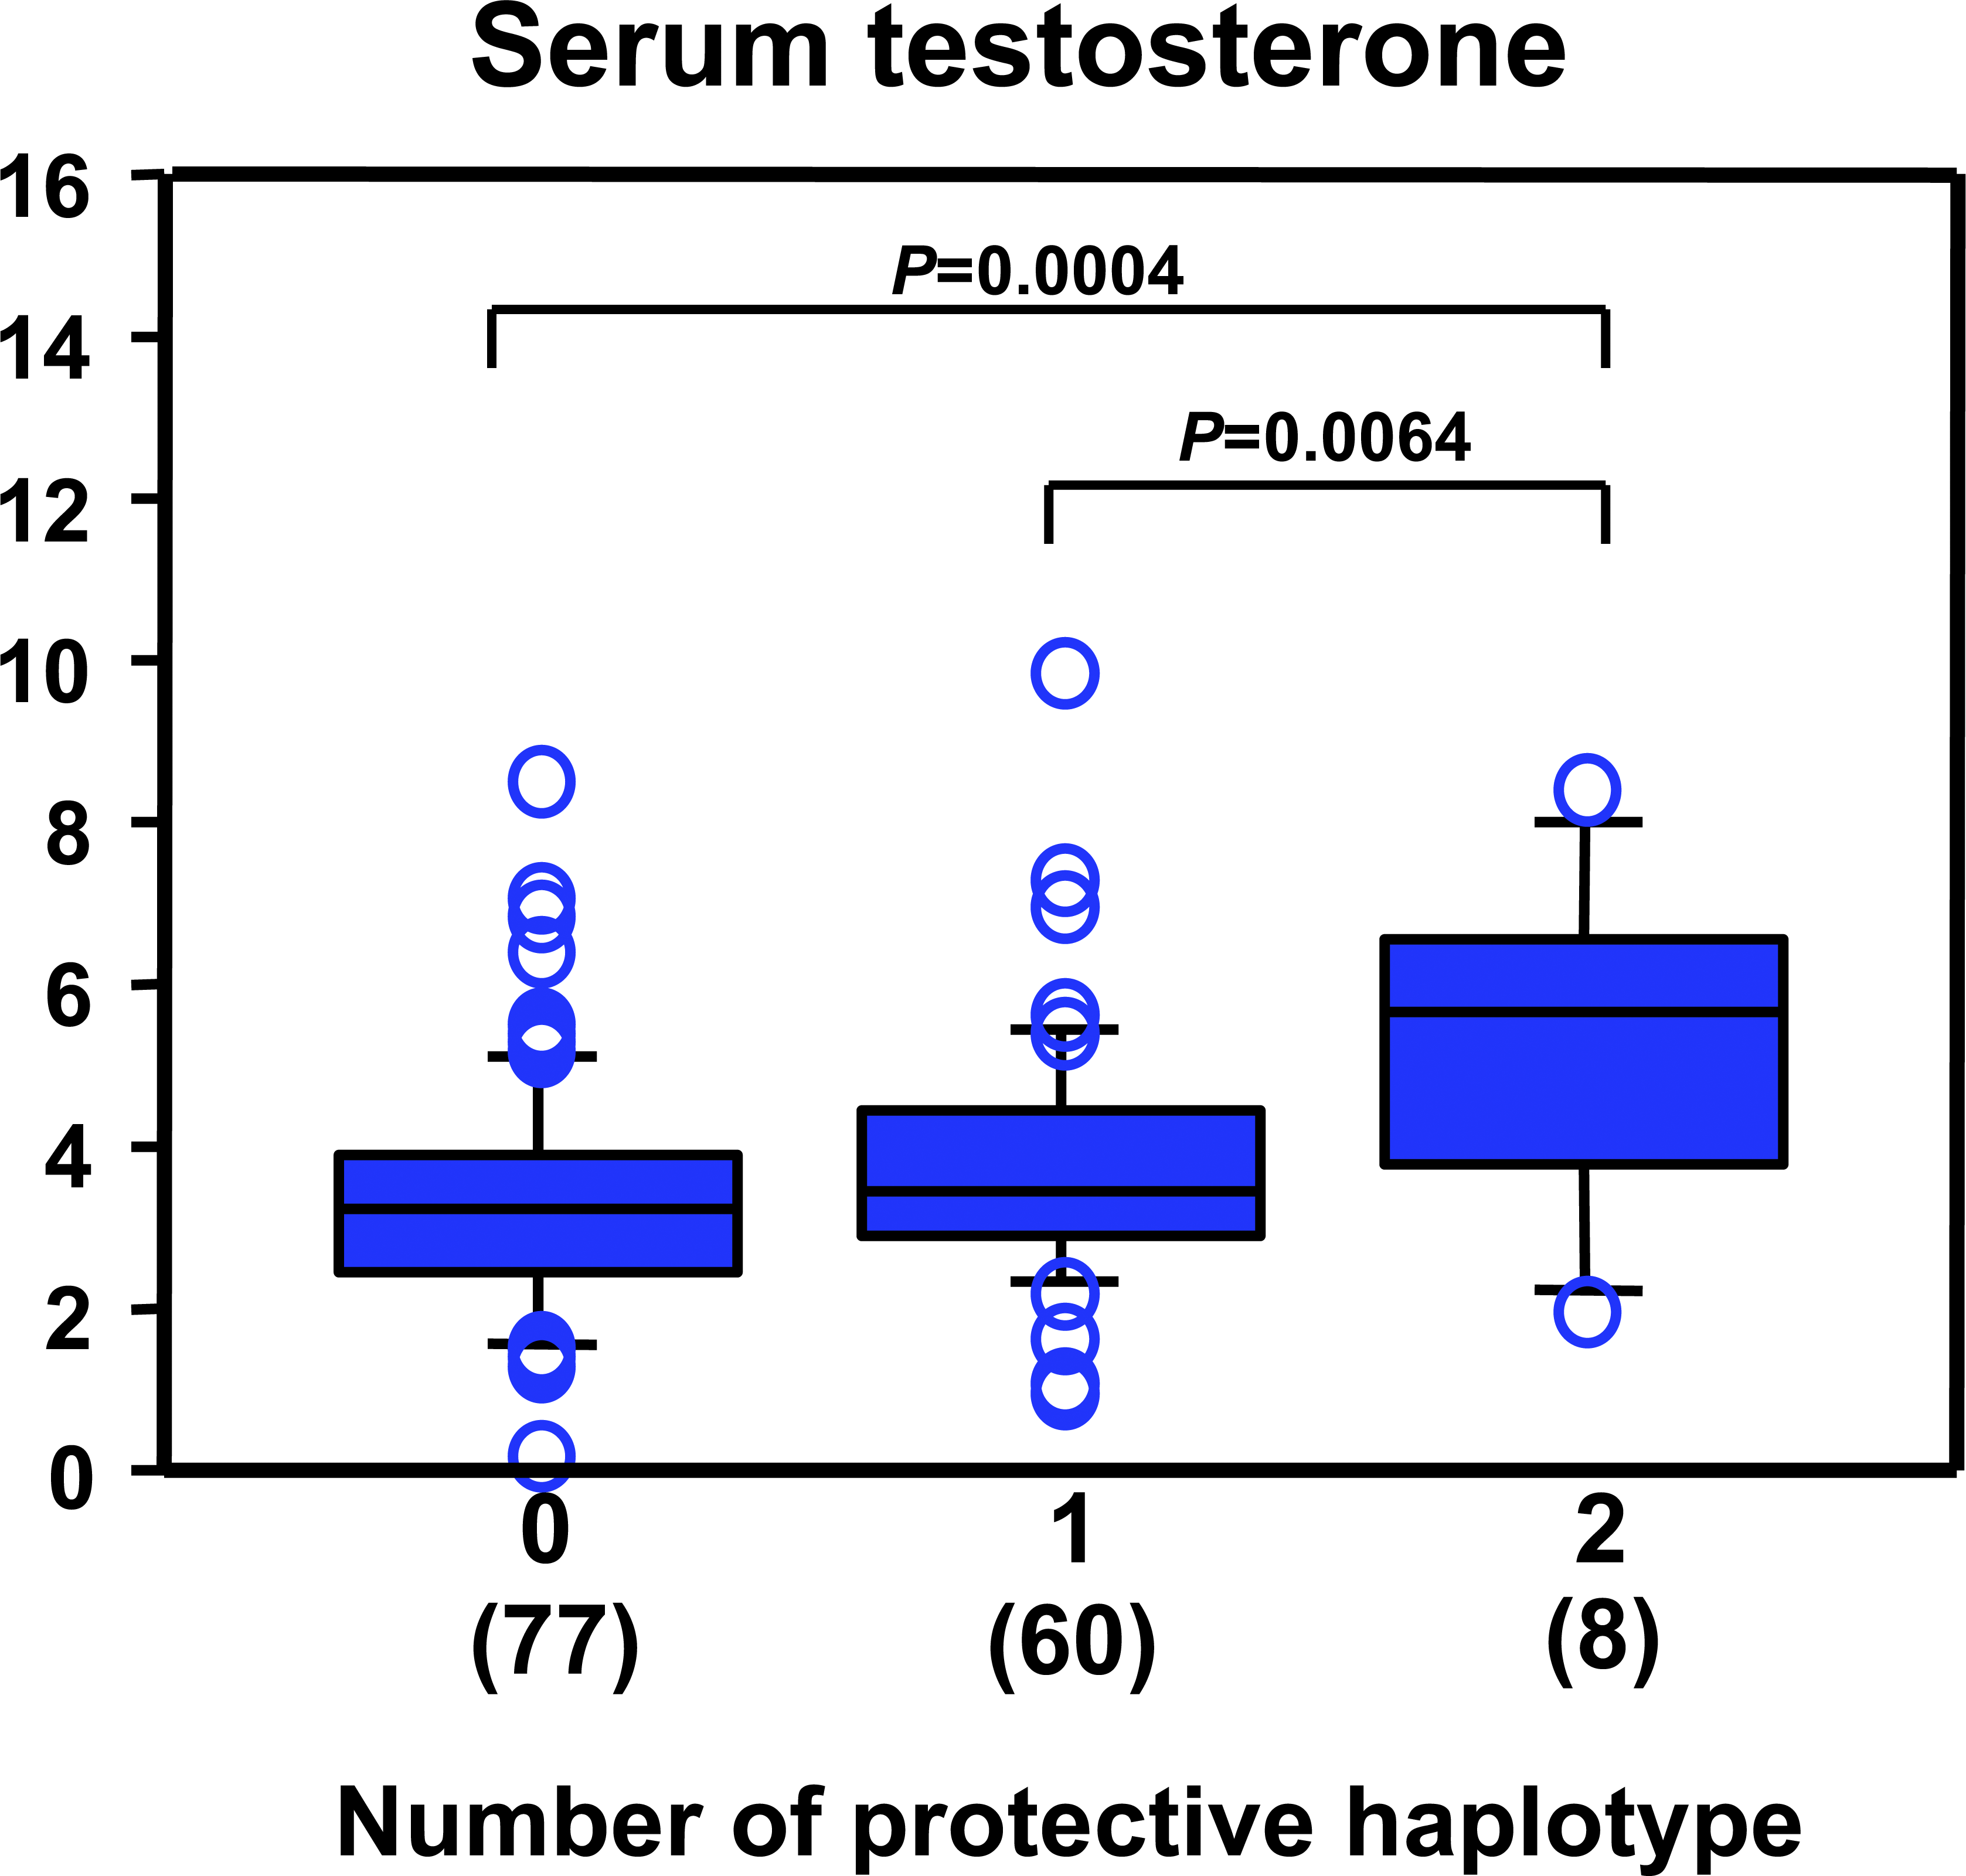
Figure 7: Diplotype-Specific Differences in Serum Testosterone Levels in NOA Patients
Three diplo-groups (code 0, 1, and 2) were defined by the number of ART3 haplotype H1 carried. The serum testosterone levels weresignificantly different among the three groups (Kruskal-Wallis; df 1⁄4 2, p1⁄4 0.0093) by Bonferroni/Dunn post hoc test.</br>doi:10.1371/journal.pgen.0040026.g007
Licensed under: https://creativecommons.org/
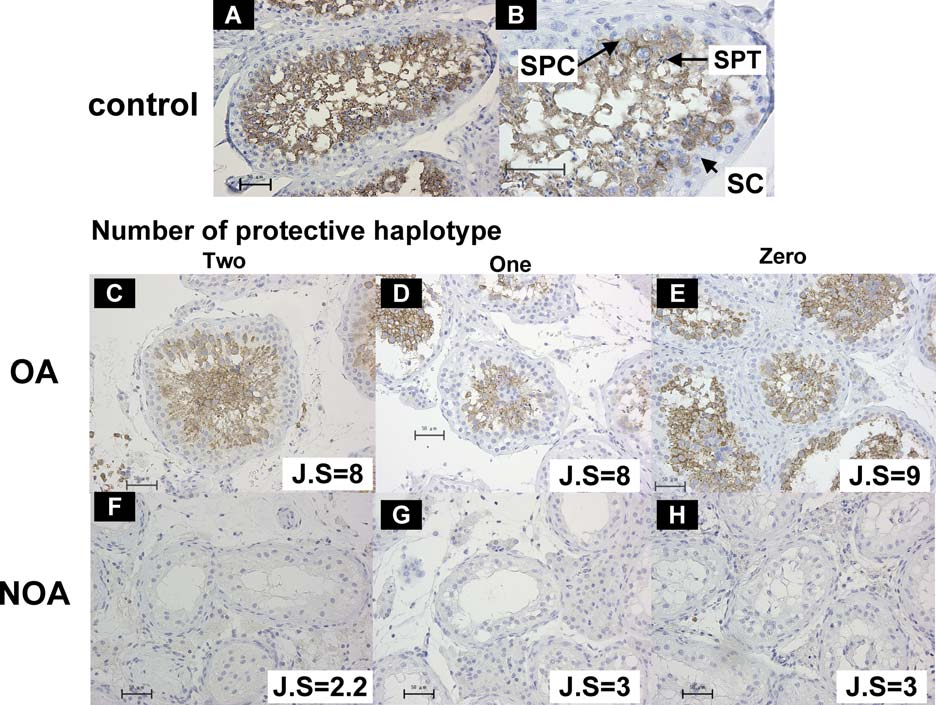
Figure 8: Immunohistochemical Analysis of ART3 Expression in Human Testes
Representative seminiferous tubules in testicular sections from normal controls (A, B), OA (C–E), and NOA patients (F–H) are shown. Arrows indicatespermatocytes (SPC); spermatids (SPT); and Sertoli cells (SC) (B). ART3 protein was immunostained with anti-ART3 antibody; ART3-positivespermatocytes (SPC) are noted as brown staining cells (A–E). No marked differences in testicular ART3 expression among the three ART3 diplo-groupscarrying none, one, or two copies of the protective haplotype H1were observed in OA (C–E) and NOA (F–H) patients. Magnification is 603 except in (B)(1203).</br>doi:10.1371/journal.pgen.0040026.g008
Licensed under: https://creativecommons.org/
Results
- Table 1: Top-Ranked Ten Categories of Gene Ontology Significantly Overrepresented among 2,611 Transcripts first
- Table 2: Clinical Characteristics of Three Molecular Subclasses of NOA first
- Table 4: Allelic Association of 38 SNPs in ART3 with NOA in Japanese Population (442 NOA Patients versus 475 Controls) first
- Table S1: 149 transcripts representing statistically significant (P<0.05) differences in testicular expression between three NOA subclasses first
- Table S2: Comparison of minor allele frequencies (MAFs) at 191 SNPs of 42 genes between 190 infertile patients and 190 fertile males (1st round of initial screening) first
- Table 3. Analyses of Allelic Association between 44 SNPs of Seven Candidate Genes and Japanese NOA in Second Round of Initial Screening (380 Cases versus 380 Controls) first
- Table S3: Quantitative real-time RT-PCR assays for 51 transcripts representing highly significant differences between NOA subclassses first