The Neonatal and Adult Human Testis Defined at the Single-Cell Level
Abhishek Sohni, Kun Tan, Hye-Won Song, Dana Burow, Dirk G.de Rooij, Louise Laurent, Tung-Chin Hsieh, Raja Rabah, Saher Sue Hammoud, Elena Vicini, Miles F. Wilkinson, 05.02.2019
Abstract
Spermatogenesis has been intensely studied in rodents but remains poorly understood in humans. Here, we used single-cell RNA sequencing to analyze human testes. Clustering analysis of neonatal testes reveals several cell subsets, including cell populations with characteristics of primordial germ cells (PGCs) and spermatogonial stem cells (SSCs). In adult testes, we identify four undifferentiated spermatogonia (SPG) clusters, each of which expresses specific marker genes. We identify protein markers for the most primitive SPG state, allowing us to purify this likely SSC-enriched cell subset. We map the timeline of male germ cell development from PGCs through fetal germ cells to differentiating adult SPG stages. We also define somatic cell subsets in both neonatal and adult testes and trace their developmental trajectories. Our data provide a blueprint of the developing human male germline and supporting somatic cells. The PGC-like and SSC markers are candidates to be used for SSC therapy to treat infertility.
SOHNI, Abhishek, et al. The Neonatal and Adult Human Testis Defined at the Single-Cell Level. Cell reports, 2019, 26. Jg., Nr. 6, S. 1501-1517. e4.
Publication: https://doi.org/10.1016/j.celrep.2019.01.045 Repository: https://www.ncbi.nlm.nih.gov/geo/query/acc.cgi?acc=GSE124263
 Disclaimer
The publication The Neonatal and Adult Human Testis Defined at the Single-Cell Level by Abhishek Sohni, Kun Tan, Hye-Won Song, Dana Burow, Dirk G.de Rooij, Louise Laurent, Tung-Chin Hsieh, Raja Rabah, Saher Sue Hammoud, Elena Vicini, Miles F. Wilkinson is published under an open access no derivatives license: : https://creativecommons.org/licenses/by-nc-nd/4.0/. Granted rights: share — copy and redistribute the material in any medium or format. No alterations allowed. Thus, tables can not be shown in MFGA format.
Curation by the MFGA team Relevant data sets presented in the publication have been identified. If possible, annotations (title, general information, conditions, processed tissue types and processed cell types) have been added based on information from the publication. Data tables and images that provide a good overview on the publication's findings on the data set have been extracted from the publication and/or supplement. If not stated otherwise, images are depicted with title and description exactly as in the publication. Tables have been adjusted to the MFGA table format. Conducted adjustments are explained in the detailed view of the tables. However, titles and descriptions have been adopted from the publication.
Data set 1: Cell Subsets in the Adult Human Testis Defined by scRNA-Seq and DEGs Corresponding to Adult and Neonatal Germ Cell Clusters
Transcriptome: Single-cell RNA-Sequencing
Species
| Species |
|---|
| Human |
Conditions
| Human phenotype ontology | Participants | Comment |
|---|---|---|
| HP:control | 4 | 7,974 ITGA6+ and 10,749 unfractionated cells from two fertile adults (aged 37 and 42 years) and 6,086 ITGA6+ cells and 8,776 unfractionated cells from neonatal testes (total from 2 individuals) |
Tissue Types
| BRENDA tissue ontology | Maturity | Description | Species | Replicates |
|---|---|---|---|---|
| BTO_0001363: testis | Neonatal | Human | 2 | |
| BTO_0001363: testis | Adult | Human | 2 |
Cell Types
| Cell ontology | Maturity | Description | Species | Replicates | Cells per replicate |
|---|---|---|---|---|---|
| CL_0000017: spermatocyte | Adult | SPC | Human | 2 | |
| CL_0000018: spermatid | Adult | ST | Human | 2 | |
| CL_0002481: peritubular myoid cell | Adult | PTM | Human | 2 | |
| CL_0000178: Leydig cell | Adult | LC | Human | 2 | |
| CL_0000115: endothelial cell | Adult | EC | Human | 2 | |
| CL_0000235: macrophage | Adult | M | Human | 2 | |
| PLANA_0000219: spermatogonial stem cell | Adult | SSC | Human | 2 | |
| CL_0000020: spermatogonium | Adult | Type I and II, early differentiating and differentiating spermatogonia | Human | 2 | |
| CL_0000081: blood cell | Adult | Human | 2 | ||
| CL_0000020: spermatogonium | Neonatal | Pre-Spermatogonia type I | Human | 2 | |
| CL_0000020: spermatogonium | Neonatal | Pre-Spermatogonia type II | Human | 2 | |
| Primordial | PGCLC | Human | 2 |
Images
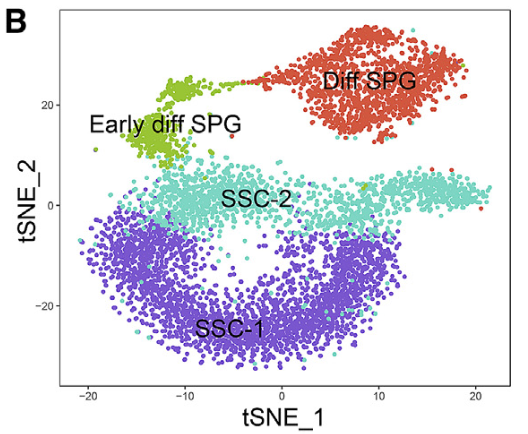
Figure 1 B: SPG subsets defined by clustering analysis
Figure 1 B, part I: The tSNE plot was generated from the cells in the SPG subset defined in (A).
Licensed under: https://creativecommons.org/licenses/by-nc-nd/4.0/
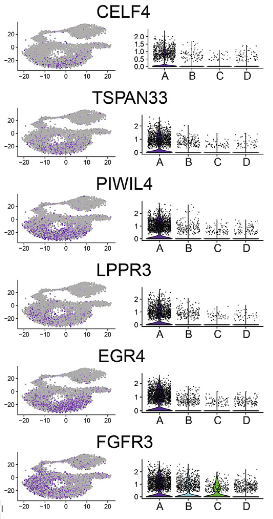
Figure 1 B: SPG subsets defined by clustering analysis
Figure 1 B, part II: The feature plots (left) and violin plots (right) show the expression pattern of markers (both known and new) that chart the progression of human SPG. A= SSC-1; B= SSC-2; C= Early diff. SPG; D= Diff. SPG.
Licensed under: https://creativecommons.org/licenses/by-nc-nd/4.0/
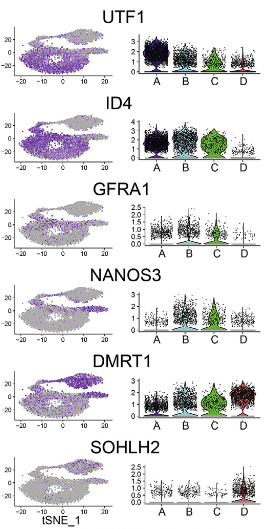
Figure 1 B: SPG subsets defined by clustering analysis
Figure 1 B, part III: The feature plots (left) and violin plots (right) show the expression pattern of markers (both known and new) that chart the progression of human SPG. A= SSC-1; B= SSC-2; C= Early diff. SPG; D= Diff. SPG.
Licensed under: https://creativecommons.org/licenses/by-nc-nd/4.0/
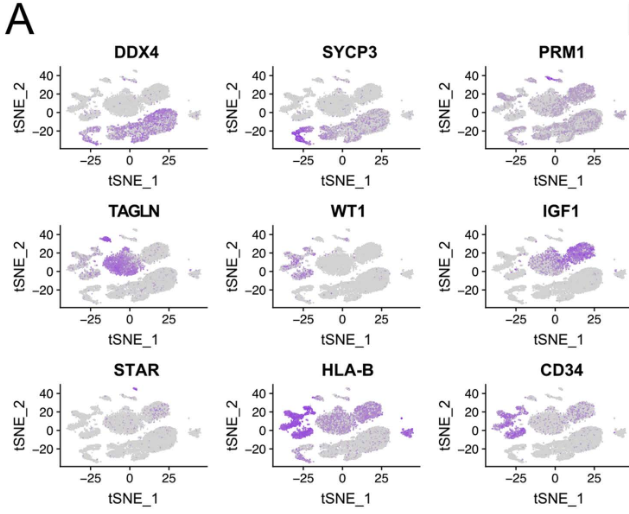
Figure S1 A: Identification of adult human testicular cell subsets and markers (related to figure 1)
tSNE feature plots of some of the known marker genes used to identify the cell clusters in figure 1 A.
Licensed under: https://creativecommons.org/licenses/by-nc-nd/4.0/
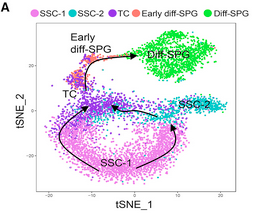
Figure 2A: Identification and Characterization of Human Undifferentiated SPG Subsets
tSNE plot from Figure 1 B showing that TCs are predominantly at the juxtaposition point of SSC-1, SSC-2, and Early diff-SPG subsets (top). The feature plot shows the expression of some gene markers enriched in TCs (bottom). The arrows indicate the developmental directionality of the cell subsets, based on our model (see text).
Licensed under: https://creativecommons.org/licenses/by-nc-nd/4.0/
Results
- Table S2: DEGs in PGCLCs, PreSPG-I and PreSPG-II relative to all other neonatal germ cell clusters first
- Table S2: DEGs in the SSC-I-A, B, C subsets relative to the whole adult SSC-I cluster first
- Table S2: DEGS in the SSC-I and II, TC, early diff-SPG and diff-SPG relative to all other adult SPG subsets first
- Table S1: List of Gene Markers Used to Identify Somatic and Germ Cell Clusters first
Data set 2: Germ Cell Subsets in Neonatal Human Testes and Somatic Cell Gene Expression
Transcriptome: Single-cell RNA-Sequencing
Species
| Species |
|---|
| Human |
Conditions
| Human phenotype ontology | Participants | Comment |
|---|---|---|
| HP:other: Other | 2 | two newborns (2 days and 7 days old) |
Tissue Types
| BRENDA tissue ontology | Maturity | Description | Species | Replicates |
|---|---|---|---|---|
| BTO_0001363: testis | Neonatal | Human | 2 |
Cell Types
| Cell ontology | Maturity | Description | Species | Replicates | Cells per replicate |
|---|---|---|---|---|---|
| CL_0000586: germ cell | Neonatal | Human | 2 | ||
| CL_0000216: Sertoli cell | Neonatal | Human | 2 | ||
| CL_0000178: Leydig cell | Neonatal | Human | 2 | ||
| CL_0000115: endothelial cell | Neonatal | Human | 2 | ||
| CL_0000081: blood cell | Neonatal | Human | 2 | ||
| CL_0000020: spermatogonium | Neonatal | Pre-Spermatogonia | Human | 2 | |
| CL_0000670: primordial germ cell | Neonatal | Human | 2 |
Images
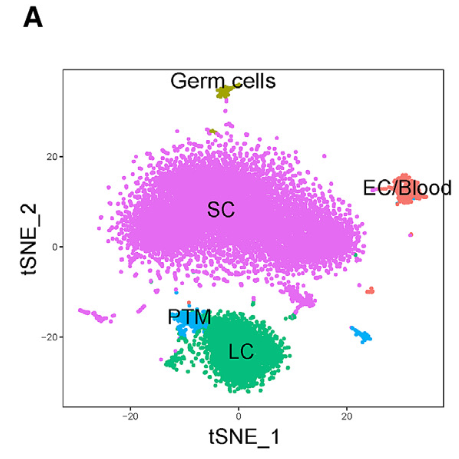
Figure 4 A: Identification and Characterization of Neonatal Germ Cells
(A) tSNE plot of neonatal human testicular cells analyzed by scRNA-seq analysis. Cell subsets were identified based on the expression pattern of knownmarkergenes (Figure S4 A). The fraction of the total cells in each subset is: germ cells (1%), Sertoli cell (SC) (59%), LC (32%), PTM (5%), and EC and blood (4%).
Licensed under: https://creativecommons.org/licenses/by-nc-nd/4.0/
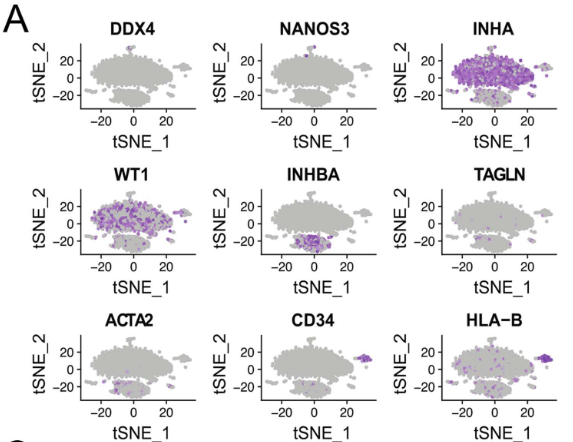
Figure S4 A: Characterization of neonatal germ cell subsets and markers (related to figure 4)
tSNE feature plots of someof the known marker genes used to identify the cell clusters in neonatal human testes in figure 4A.
Licensed under: https://creativecommons.org/licenses/by-nc-nd/4.0/
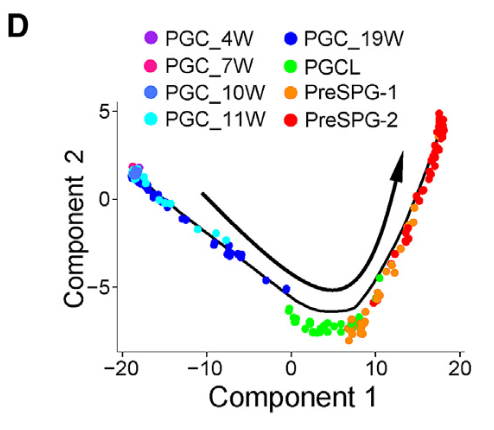
Figure 4 D: Identification and Characterization of Neonatal Germ Cells
(D) Developmental timeline of PGCs and neonatal germ cell subsets. The top shows Monocle pseudotime trajectory analysis of the neonatal germ cell subsets defined in (B), as well as PGCs at the gestational ages indicated from Guo et al. (2015). The arrow indicates the developmental direction, based on the 4-week PGC and PreSPG subsets being the least and most differentiated, respectively. The expression pattern of marker genes is plotted along the pseudotime axis (bottom left) and with violin plots (bottom right).
Licensed under: https://creativecommons.org/licenses/by-nc-nd/4.0/
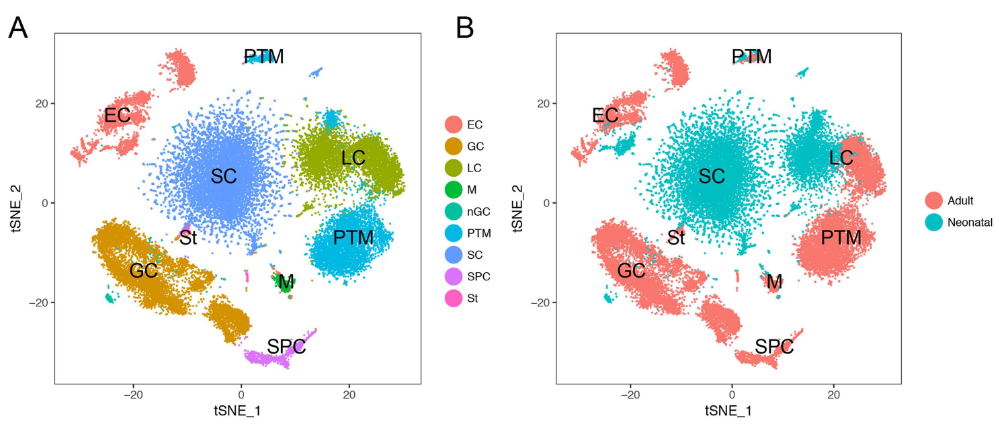
Figure S5 AB: Characterization and Developmental Analysis of Human Testicular Somatic cells (related to Figure 5 and 6)
A: tSNE plot of all neonatal and adult human testicular cells in our dataset. Cell cluster identities were determined from feature plots of known marker genes. B: tSNE plot of the same cells as in A, depicting the identity of the adult and neonatal cell clusters.
Licensed under: https://creativecommons.org/licenses/by-nc-nd/4.0/
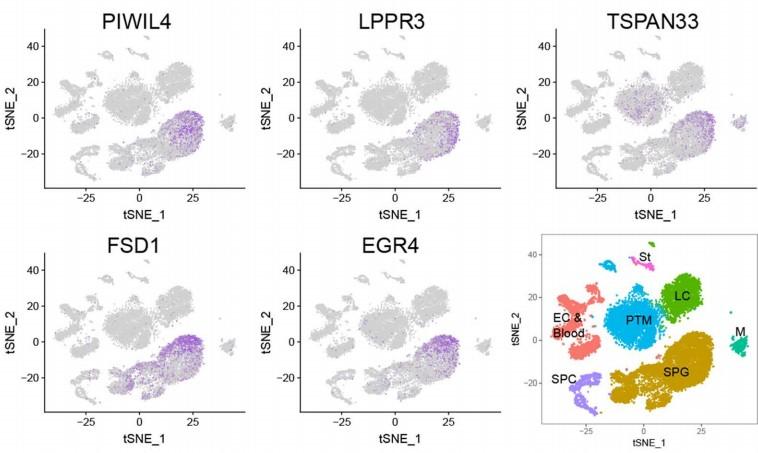
Figure S3 D: Identification of candidate and known SSC markers
tSNE feature plots of the indicated undifferentiated SPG markers in adult testicular cell subsets. Bottom right shows a tSNE plot labeled with cell types. (see also Figure 1 A).
Licensed under: https://creativecommons.org/licenses/by-nc-nd/4.0/
Results
- Table S3: DEGs in neonatal-like PTM cells in adult somatic cell relative to all other adult PTM cells first
- Table S3: DEGs in the neonatal PTM cell subset relative to all other neonatal somatic cell clusters first
- Table S3: DEGs in the adult PTM cell subset relative to all other adult somatic cell clusters first