The Mammalian Spermatogenesis Single-Cell Transcriptome, from Spermatogonial Stem Cells to Spermatids
Brian P. Hermann, Keren Cheng, Anukriti Singh, Lorena Roa-De La Cruz, Kazadi N. Mutoji, I-Chung Chen, Heidi Gildersleeve, Jake D. Lehle, Max Mayo, Birgit Westernströer, Nathan C. Law, Melissa J. Oatley, Ellen K. Velte, Bryan A. Niedenberger, Danielle Fritze, Sherman Silber, Christopher B. Geyer, Jon M. Oatley, John R. McCarrey, 06.11.2018
Abstract
Spermatogenesis is a complex and dynamic cellular differentiation process critical to male reproduction and sustained by spermatogonial stem cells (SSCs). Although patterns of gene expression have been described for aggregates of certain spermatogenic cell types, the full continuum of gene expression patterns underlying ongoing spermatogenesis in steady state was previously unclear. Here, we catalog single-cell transcriptomes for >62,000 individual spermatogenic cells from immature (postnatal day 6) and adult male mice and adult men. This allowed us to resolve SSC and progenitor spermatogonia, elucidate the full range of gene expression changes during male meiosis and spermiogenesis, and derive unique gene expression signatures for multiple mouse and human spermatogenic cell types and/or subtypes. These transcriptome datasets provide an information-rich resource for studies of SSCs, male meiosis, testicular cancer, male infertility, or contraceptive development, as well as a gene expression roadmap to be emulated in efforts to achieve spermatogenesis in vitro.
HERMANN, Brian P., et al. The mammalian spermatogenesis single-cell transcriptome, from spermatogonial stem cells to spermatids. Cell reports, 2018, 25. Jg., Nr. 6, S. 1650-1667. e8.
Publication: https://doi.org/10.1016/j.celrep.2018.10.026 Repository: https://www.ncbi.nlm.nih.gov/geo/query/acc.cgi?acc=GSE108970; https://www.ncbi.nlm.nih.gov/geo/query/acc.cgi?acc=GSE108974; https://www.ncbi.nlm.nih.gov/geo/query/acc.cgi?acc=GSE108977; https://www.ncbi.nlm.nih.gov/geo/query/acc.cgi?acc=GSE109049; https://www.ncbi.nlm.nih.gov/geo/query/acc.cgi?acc=GSE109033; https://www.ncbi.nlm.nih.gov/geo/query/acc.cgi?acc=GSE109037
 Disclaimer
The publication The Mammalian Spermatogenesis Single-Cell Transcriptome, from Spermatogonial Stem Cells to Spermatids by Brian P. Hermann, Keren Cheng, Anukriti Singh, Lorena Roa-De La Cruz, Kazadi N. Mutoji, I-Chung Chen, Heidi Gildersleeve, Jake D. Lehle, Max Mayo, Birgit Westernströer, Nathan C. Law, Melissa J. Oatley, Ellen K. Velte, Bryan A. Niedenberger, Danielle Fritze, Sherman Silber, Christopher B. Geyer, Jon M. Oatley, John R. McCarrey is published under an open access no derivatives license: : https://creativecommons.org/licenses/by-nc-nd/4.0/. Granted rights: share — copy and redistribute the material in any medium or format. No alterations allowed. Thus, tables can not be shown in MFGA format.
Curation by the MFGA team Relevant data sets presented in the publication have been identified. If possible, annotations (title, general information, conditions, processed tissue types and processed cell types) have been added based on information from the publication. Data tables and images that provide a good overview on the publication's findings on the data set have been extracted from the publication and/or supplement. If not stated otherwise, images are depicted with title and description exactly as in the publication. Tables have been adjusted to the MFGA table format. Conducted adjustments are explained in the detailed view of the tables. However, titles and descriptions have been adopted from the publication.
Data set 1: Single-Cell Transcriptomes of Human Steady-State Spermatogenic Cells
Transcriptome: Single-cell RNA-Sequencing
Species
| Species |
|---|
| Human |
Tissue Types
| BRENDA tissue ontology | Maturity | Description | Species | Replicates |
|---|---|---|---|---|
| BTO_0001363: testis | Adult | Seminiferous epithelium of testis | Human | |
| BTO_0001235: seminiferous tubule | Adult | Human |
Cell Types
| Cell ontology | Maturity | Description | Species | Replicates | Cells per replicate |
|---|---|---|---|---|---|
| CL_0000019: sperm | Adult | spermatogenic cells, comprising all analysed cells | Human | 7134.0 | |
| CL_0000020: spermatogonium | Adult | Human | |||
| CL_0000017: spermatocyte | Adult | Human | |||
| CL_0000018: spermatid | Adult | Human |
Images
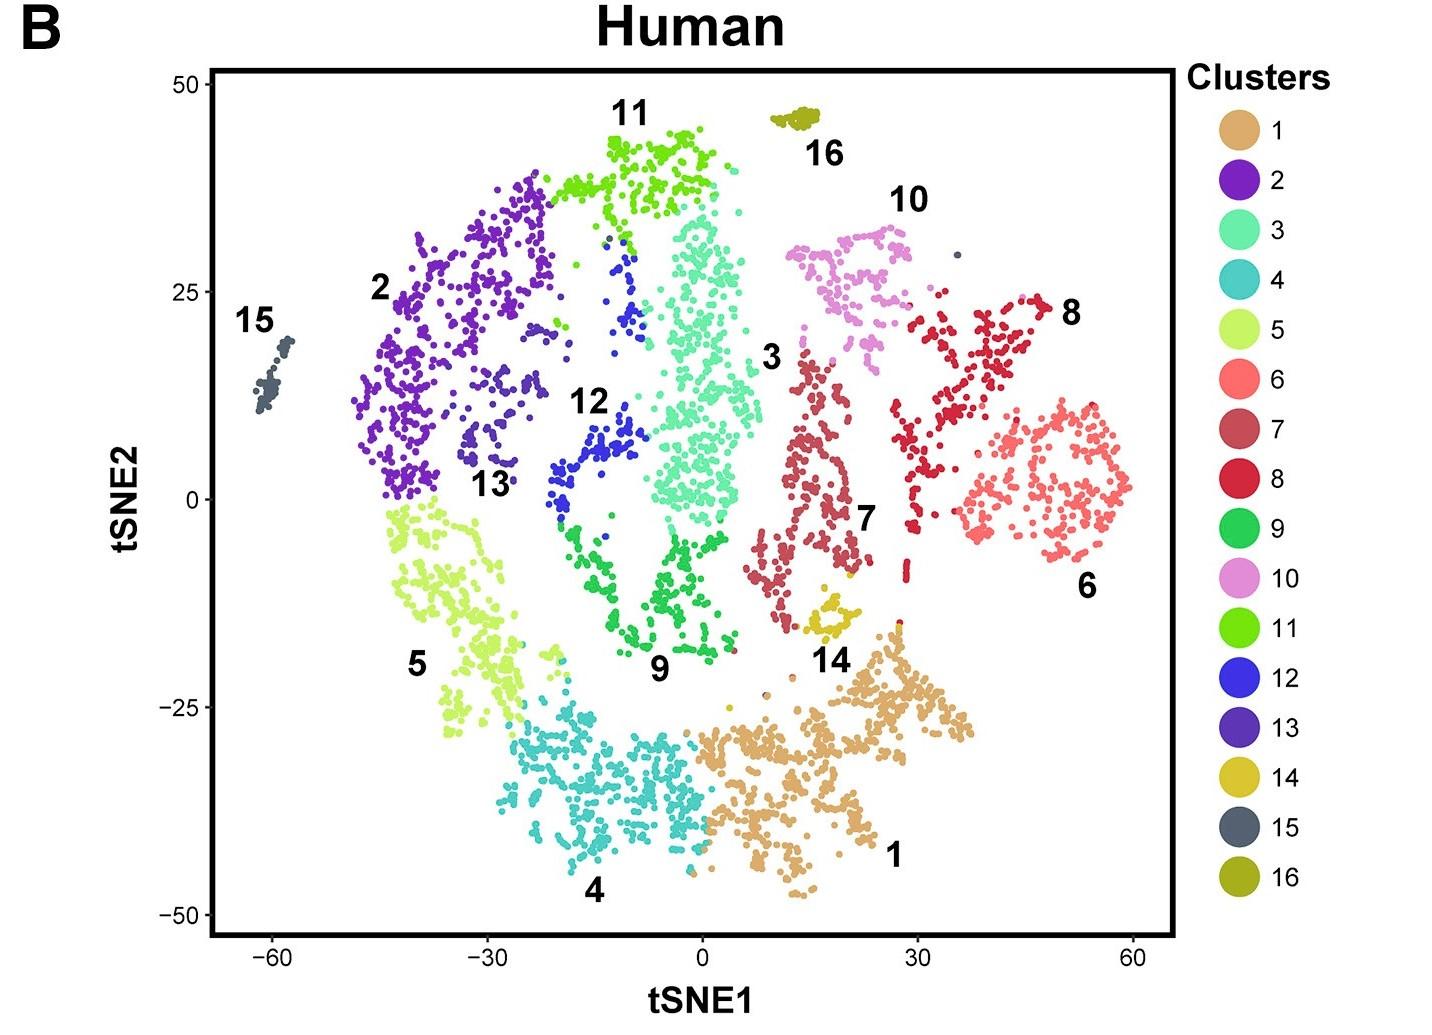
Figure 1 B: tSNE plots show 10x Genomics profiling of unselected spermatogenic cells from human testes
Unbiased cell clusters are distinguished by color according to the key.
Licensed under: https://creativecommons.org/licenses/by-nc-nd/4.0/
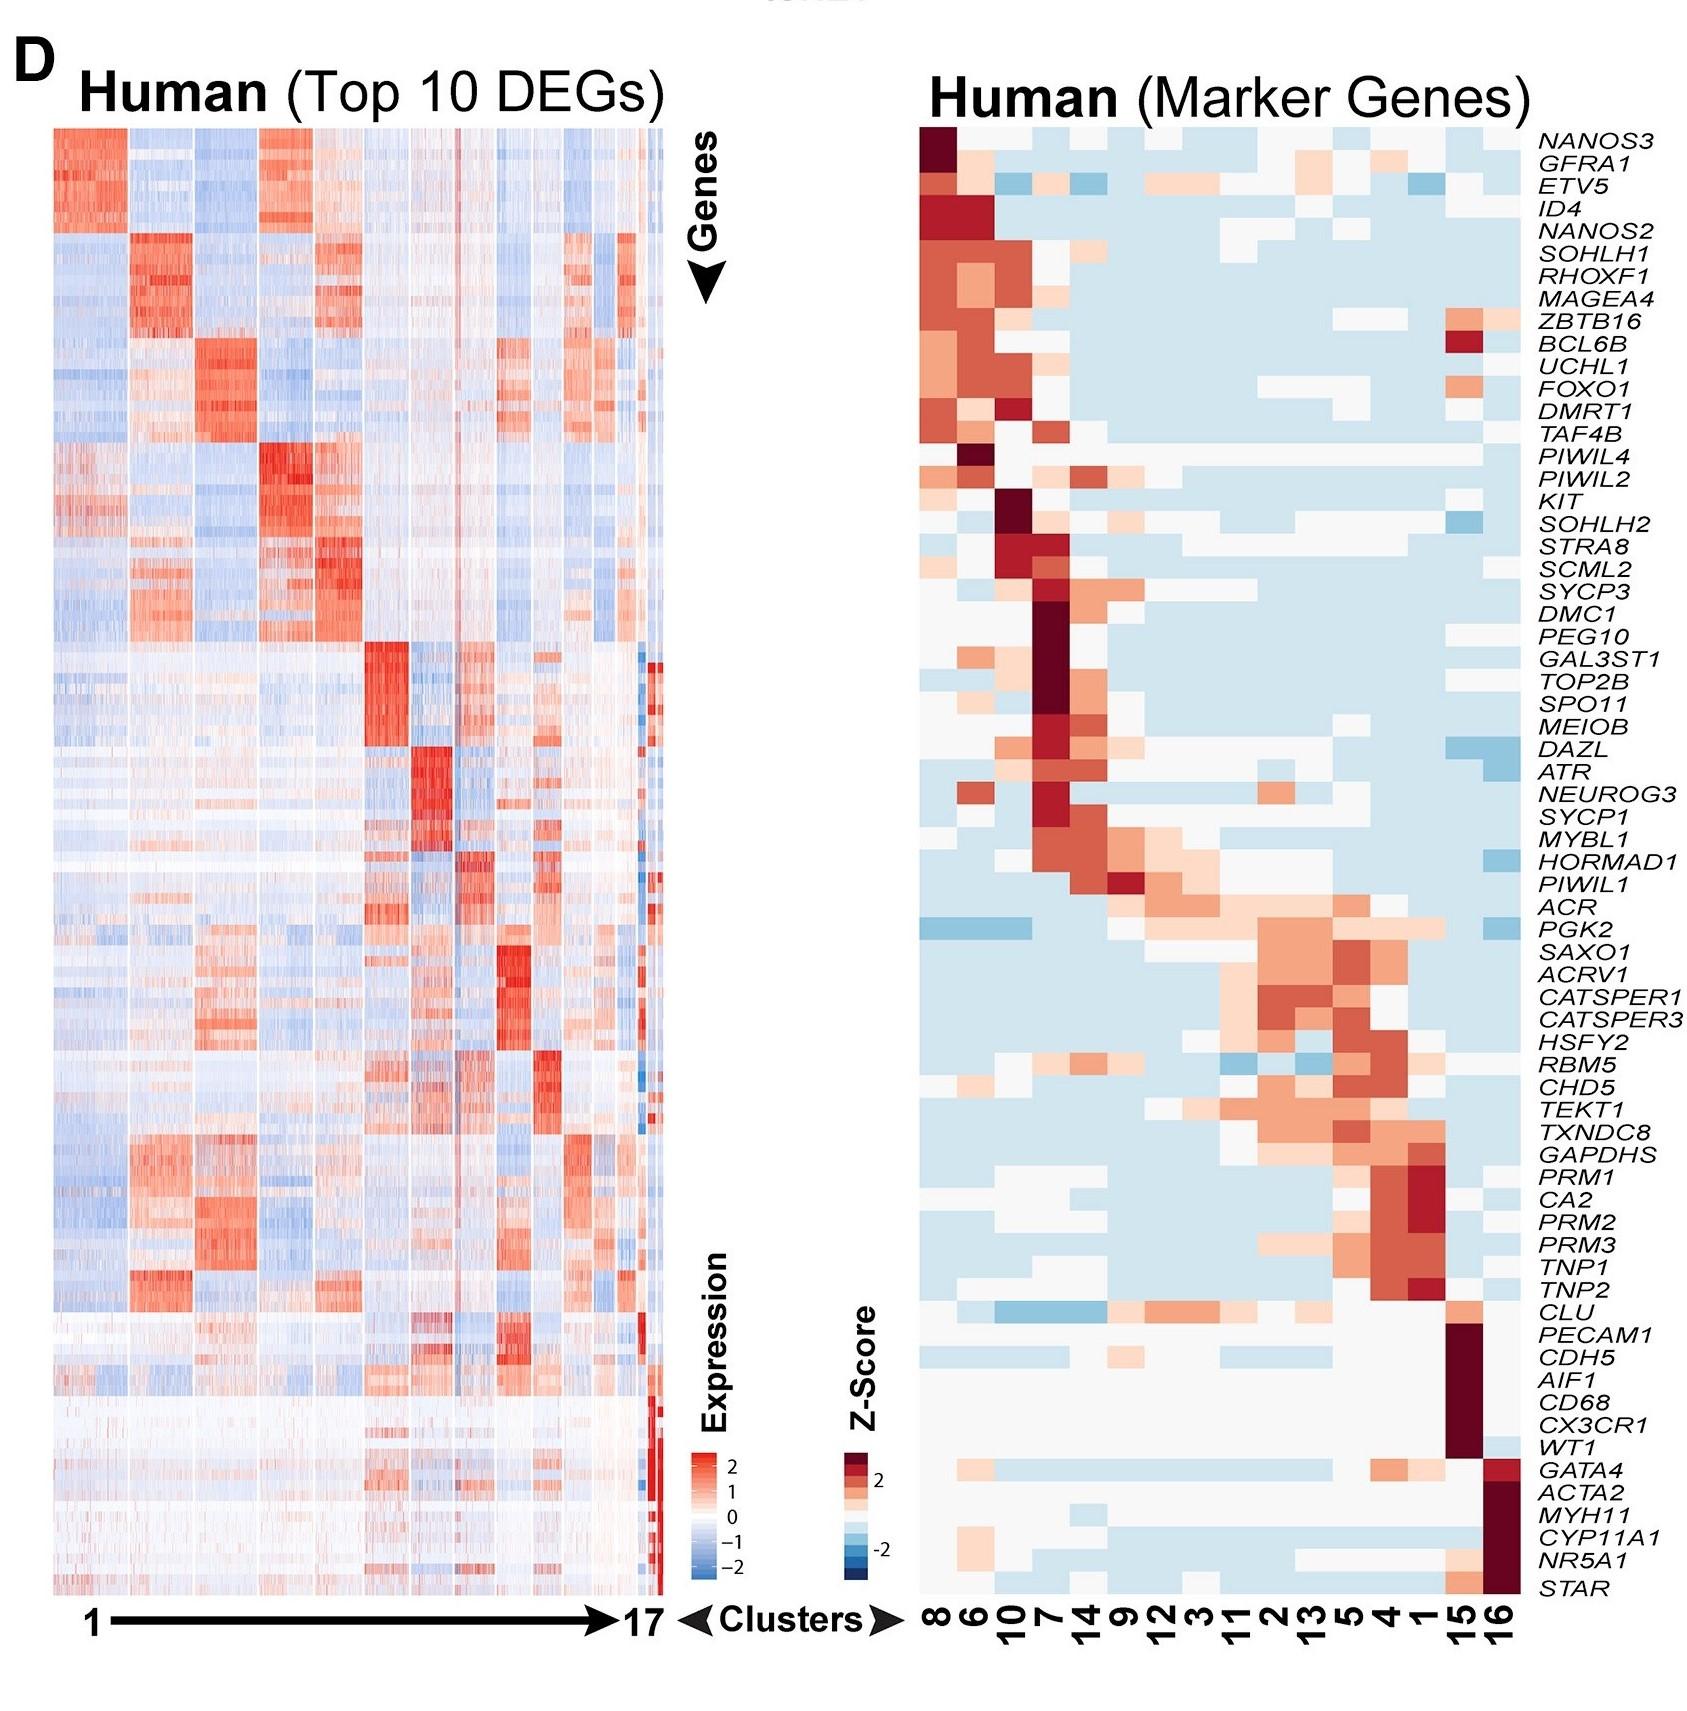
Figure 1 D: Top 10 significantly differentially expressed genes (DEGs) in human spermatogenic cells
Heatmap shows the top 10 significantly differentially expressed genes (DEGs) between each cell cluster (left) and expression of key cell-type-specific markers (right) in human spermatogenic cells. Gene lists can be found in Table S1.
Licensed under: https://creativecommons.org/licenses/by-nc-nd/4.0/
Data set 2: Single-Cell Transcriptomes of Mouse Steady-State Spermatogenic Cells
Transcriptome: Single-cell RNA-Sequencing
Species
| Species |
|---|
| Mouse |
Tissue Types
| BRENDA tissue ontology | Maturity | Description | Species | Replicates |
|---|---|---|---|---|
| BTO_0001363: testis | Adult | Seminiferous epithelium of testis | Mouse | |
| BTO_0001235: seminiferous tubule | Adult | Mixed seminiferous tubule cells | Mouse |
Cell Types
| Cell ontology | Maturity | Description | Species | Replicates | Cells per replicate |
|---|---|---|---|---|---|
| CL_0000019: sperm | Adult | spermatogenic cells; comprising all analysed cells | Mouse | 4651.0 | |
| CL_0000020: spermatogonium | Adult | Mouse | |||
| CL_0000017: spermatocyte | Adult | Mouse | |||
| CL_0000018: spermatid | Adult | Mouse |
Images
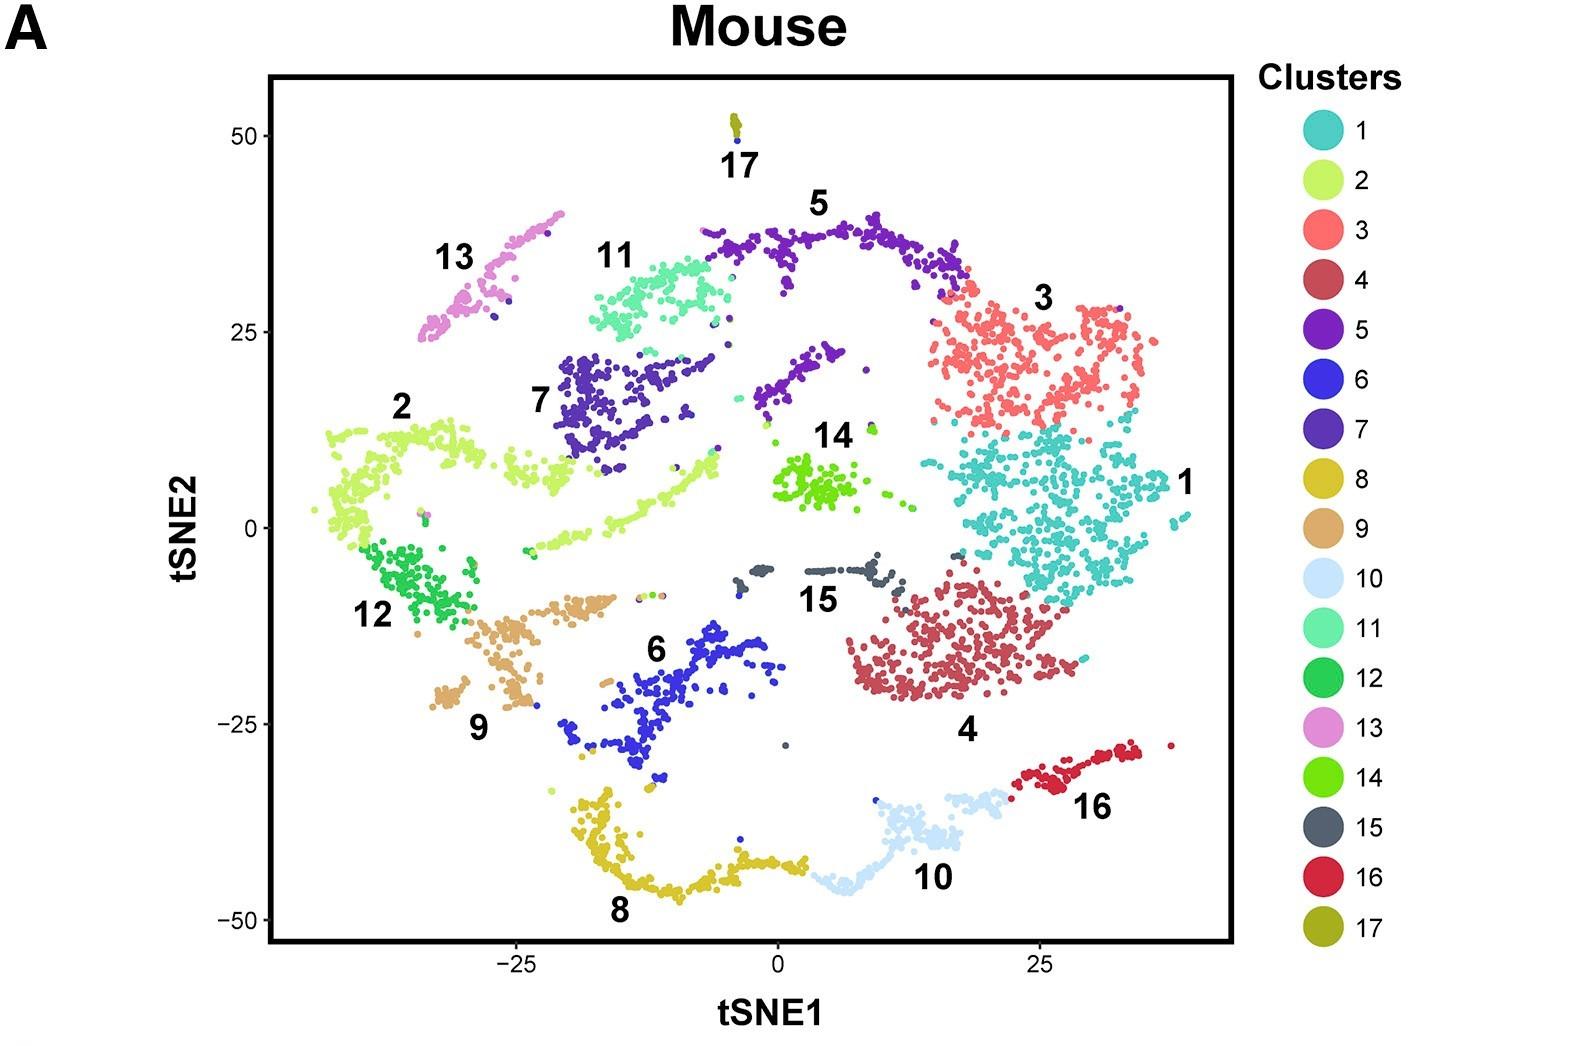
Figure 1 A: tSNE plots show 10x Genomics profiling of unselected spermatogenic cells from mouse testes
Unbiased cell clusters are distinguished by color according to the key.
Licensed under: https://creativecommons.org/licenses/by-nc-nd/4.0/
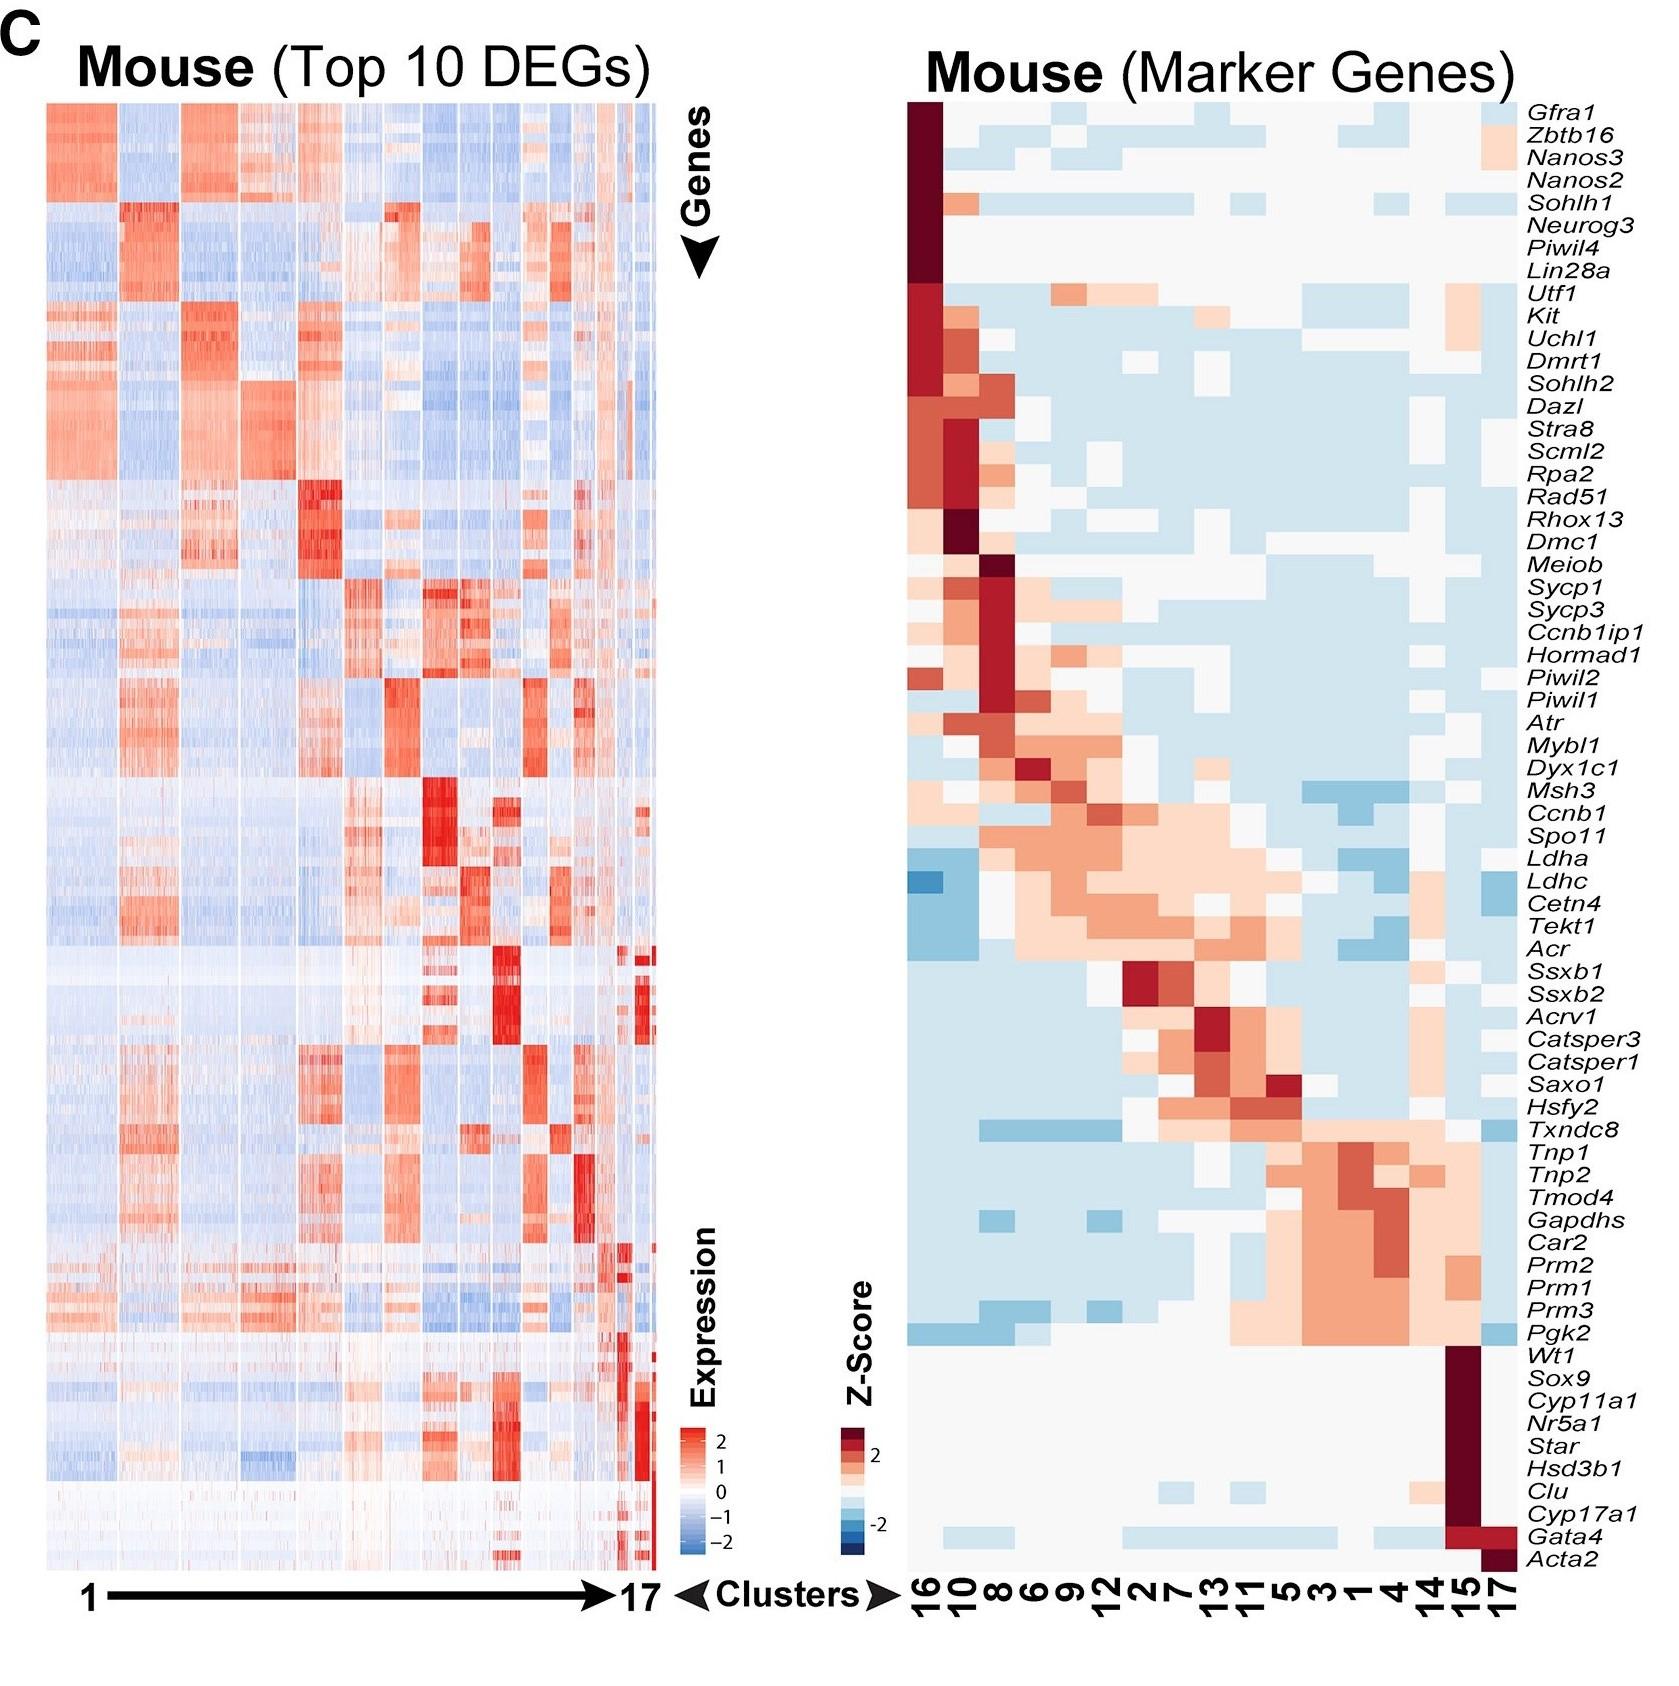
Figure 1 C: Top 10 significantly differentially expressed genes (DEGs) between each cell cluster
Heatmap shows the top 10 significantly differentially expressed genes (DEGs) between each cell cluster (left) and expression of key cell-type-specific markers (right) mouse spermatogenic cells. Gene lists can be found in Table S1.
Licensed under: https://creativecommons.org/licenses/by-nc-nd/4.0/
Data set 3: Heterogeneity among Adult Spermatogonia in Mice and Men and Meiotic Progression among Steady-State Spermatocytes
Transcriptome: Single-cell RNA-Sequencing
Species
| Species |
|---|
| Human |
| Mouse |
Cell Types
| Cell ontology | Maturity | Description | Species | Replicates | Cells per replicate |
|---|---|---|---|---|---|
| CL_0000017: spermatocyte | Adult | preleptotene, leptotene, and zygotene | Human | 3 | |
| CL_0000017: spermatocyte | Adult | preleptotene, leptotene, and zygotene | Mouse | 3 | |
| CL_0000020: spermatogonium | Adult | Mouse | 3 | ||
| CL_0000020: spermatogonium | Adult | Human | 3 |
Images
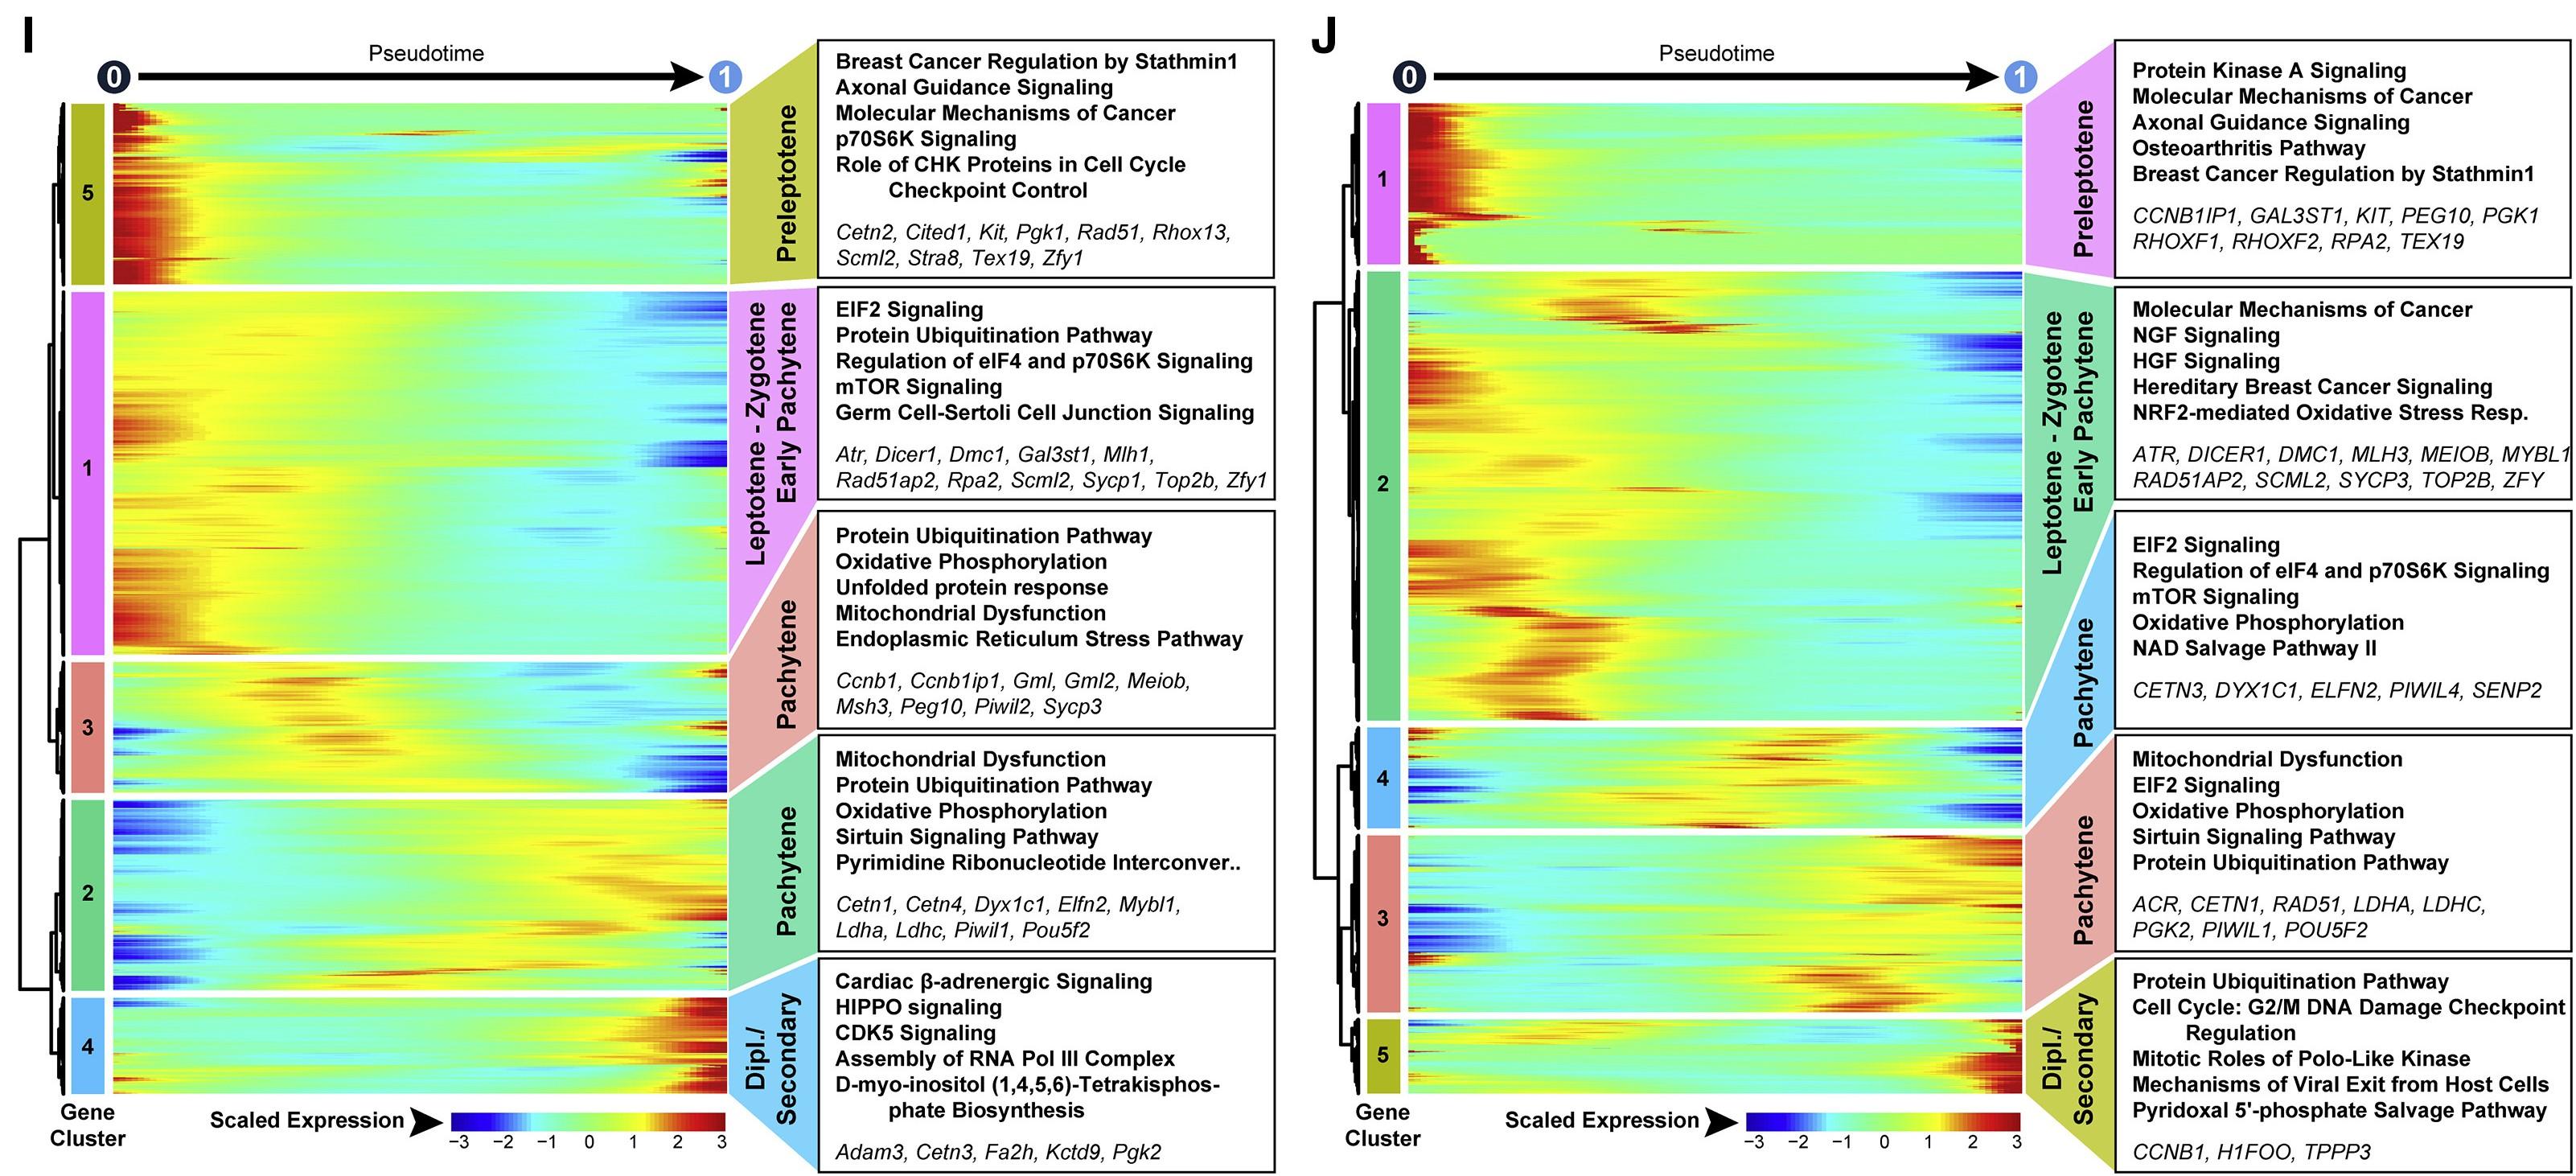
Figure 4 I and J: Heatmaps show hierarchical relationship between clusters of DEGs in human and mouse unselected spermatocytes
Heatmaps show hierarchical relationship between clusters of genes that were differentially expressed across pseudotime from (I) mouse unselected spermatocytes and (J) human unselected spermatocytes (scaled expression according to legend; see Table S2). The top five over-represented biological pathways from GO analyses of each cluster are noted at the right in bold (see Table S3), and key genes are italicized.
Licensed under: https://creativecommons.org/licenses/by-nc-nd/4.0/
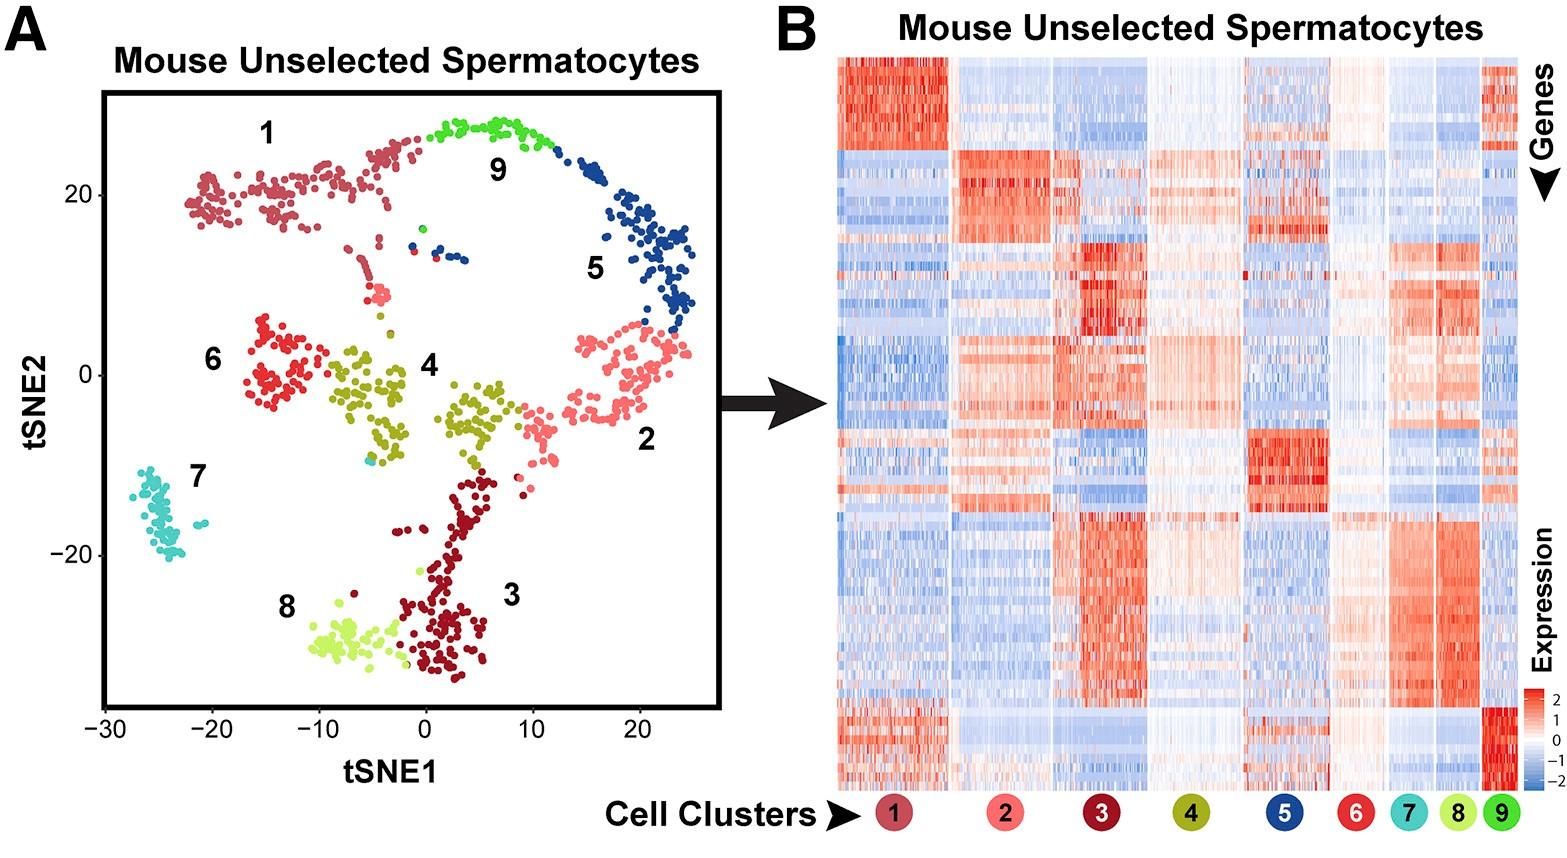
Figure 4 A and B: tSNE plot of mouse spermatocytes and Heatmap showing top ten DEGs
A: The tSNE plot shows unbiased re-clustering of unselected spermatocytes from mouse testes with color distinguishing clusters. </br>B: Heatmap shows the top 10 significantly differentially expressed genes (DEGs) between each cell cluster for mouse unselected spermatocytes. Gene lists can be found in Table S1. Colors and numbering of circles below heatmaps match the cell clusters in the corresponding tSNE plot.
Licensed under: https://creativecommons.org/licenses/by-nc-nd/4.0/
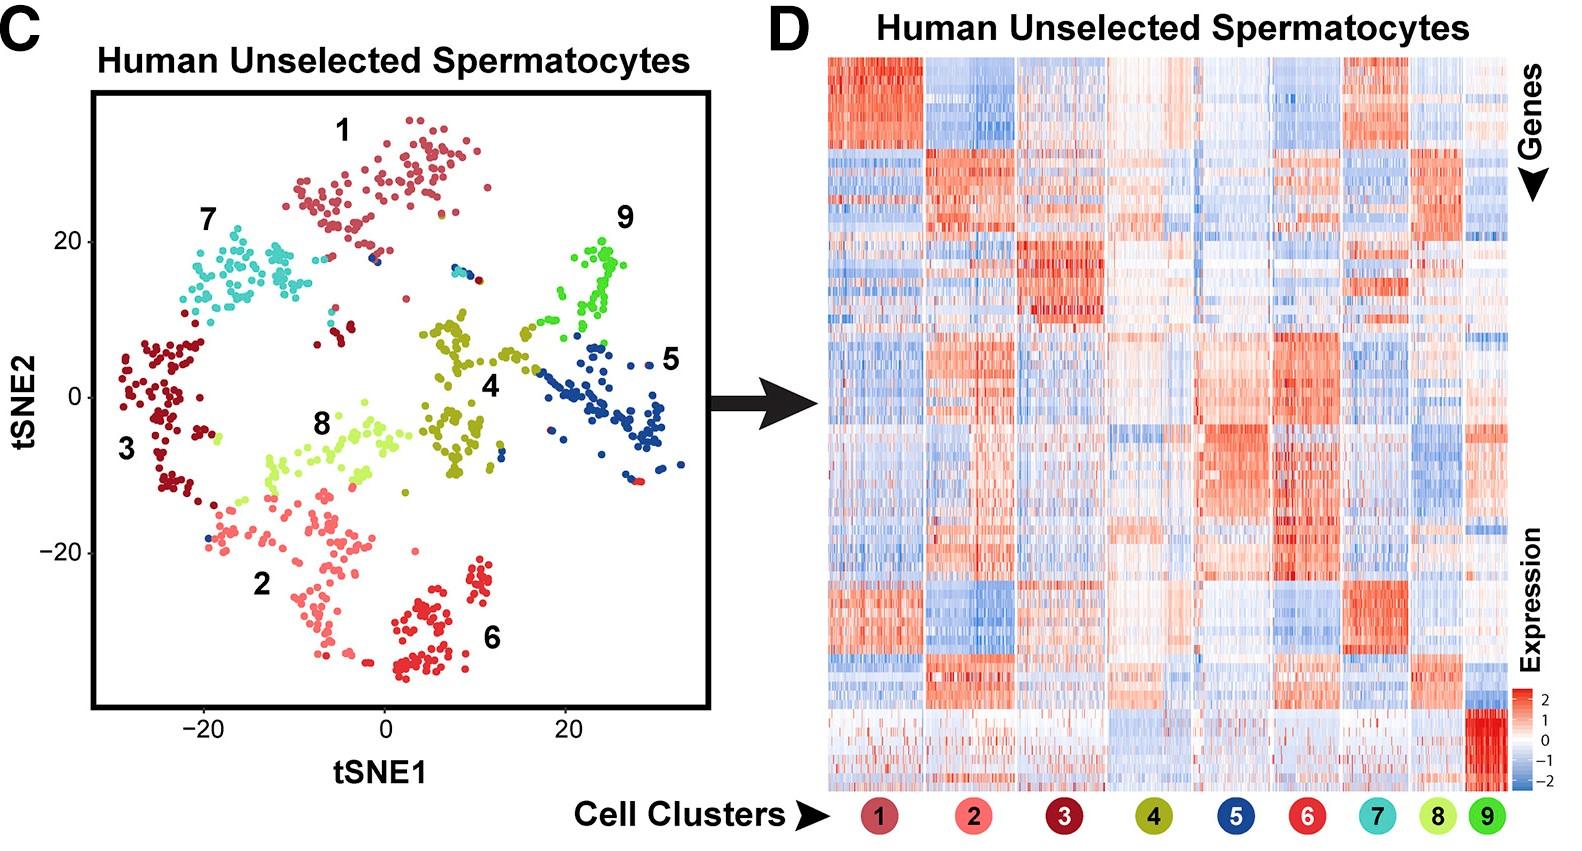
Figure 4 C and D: tSNE plot of human spermatocytes and Heatmap showing top ten DEGs
C: The tSNE plot shows unbiased re-clustering of unselected spermatocytes from human testes with color distinguishing clusters. </br>D: Heatmap shows the top 10 significantly differentially expressed genes (DEGs) between each cell cluster for human unselected spermatocytes. Gene lists can be found in Table S1. Colors and numbering of circles below heatmaps match the cell clusters in the corresponding tSNE plot.
Licensed under: https://creativecommons.org/licenses/by-nc-nd/4.0/

Figure 2 G, H, I, J: Clustering of sorted adult spermatogonia from mouse and human testes and the top 10 significantly DEGs between each cell cluster
G and I: Additional tSNE plots show unbiased clustering of sorted adult spermatogonia from (G) mouse and (I) human testes (colors distinguish clusters).</br>H and J: Heatmaps show the top 10 significantly DEGs between each cell cluster for sorted (H) mouse and (J) human spermatogonia.
Licensed under: https://creativecommons.org/licenses/by-nc-nd/4.0/
Results
- Table S1, related to Figure 4 A: Mouse unselected Spermatocytes first
- Table S1, related to Figure 4 B: Top ten DEGs Mouse unselected Spermatocytes first
- Table S1, related to Figure 4 C: Human unselected Spermatocytes first
- Table S1, related to Figure 4 D: Top ten DEGs Human unselected Spermatocytes first
- Table S1, related to Figure 2 G: Mouse sorted Spermatogonia first
- Table S1, related to Figure 2 H: Top ten DEGs Mouse sorted Spermatogonia first
- Table S1, related to Figure 2 I: Human sorted Spermatogonia first
- Table S1, related to Figure 2 J: Top ten DEGs Human sorted Spermatogonia first
- Table S1, related to Figure 2 B: Top ten Mouse unselected Spermatogonia first
- Table S1, related to Figure 2 D: Top ten Human unselected Spermatogonia first
- Table S2, related to Figure 4 I: Mouse unselected SCT Pseudotime first
- Table S2, related to Figure 4 J: Human unselected SCT Pseudotime first
- Table S4: Human and Mouse Spermatocytes comparison first
- Table S3, related to Figure 4 I: Mouse unselected SCT Pseudotime first
- Table S3, related to Figure 4 J: Human unselected SCT Pseudotime first
Data set 4: Developmental order of Spermatogonial Clusters
Transcriptome: Other
Species
| Species |
|---|
| Human |
| Mouse |
Cell Types
| Cell ontology | Maturity | Description | Species | Replicates | Cells per replicate |
|---|---|---|---|---|---|
| CL_0000020: spermatogonium | Adult | Undifferentiated and differentiating spermatogonia | Human | ||
| CL_0000020: spermatogonium | Adult | Undifferentiated and differentiating spermatogonia | Mouse | ||
| CL_0000018: spermatid | Adult | Human | |||
| CL_0000018: spermatid | Adult | Mouse | |||
| CL_0000017: spermatocyte | Adult | Mouse | |||
| CL_0000017: spermatocyte | Adult | Human |
Images
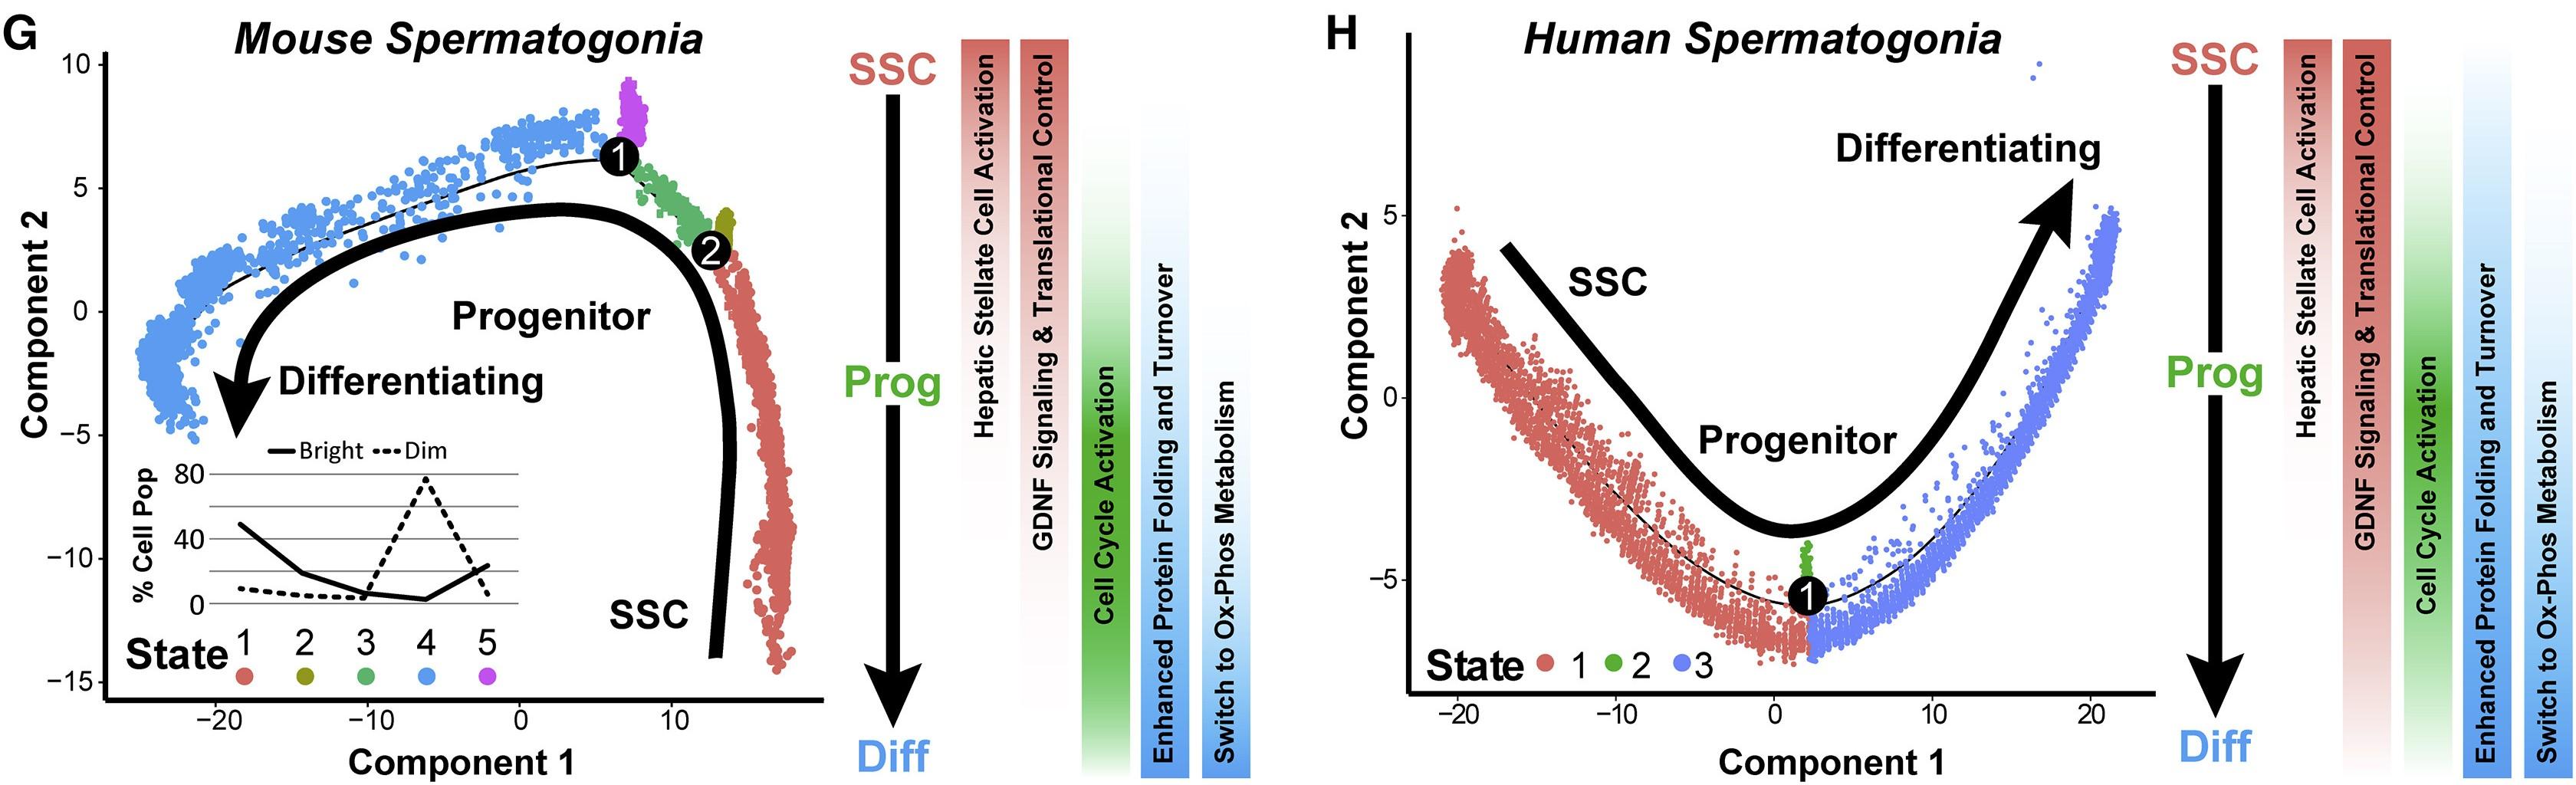
Figure 3 G and H: Single-Cell Spermatogonial Trajectories Reveal Biological Transitions Coinciding with SSC Self-Renewal and Initiation of Differentiation in Pseudotime
(G and H) Trajectories (identical to Figures 2L and 2N) from (G) adult mouse sorted spermatogonia and (H) adult human sorted spermatogonia are colored by cell state and illustrate biologically significant differences across this trajectory, which is summarized to the right of each plot. Inset graph in (G) shows the distribution (percentage) of the sorted ID4-EGFPbright spermatogonia and ID4-EGFPdim spermatogonia as shown in Figures 2O and 2P, among the noted five spermatogonial states.
Licensed under: https://creativecommons.org/licenses/by-nc-nd/4.0/
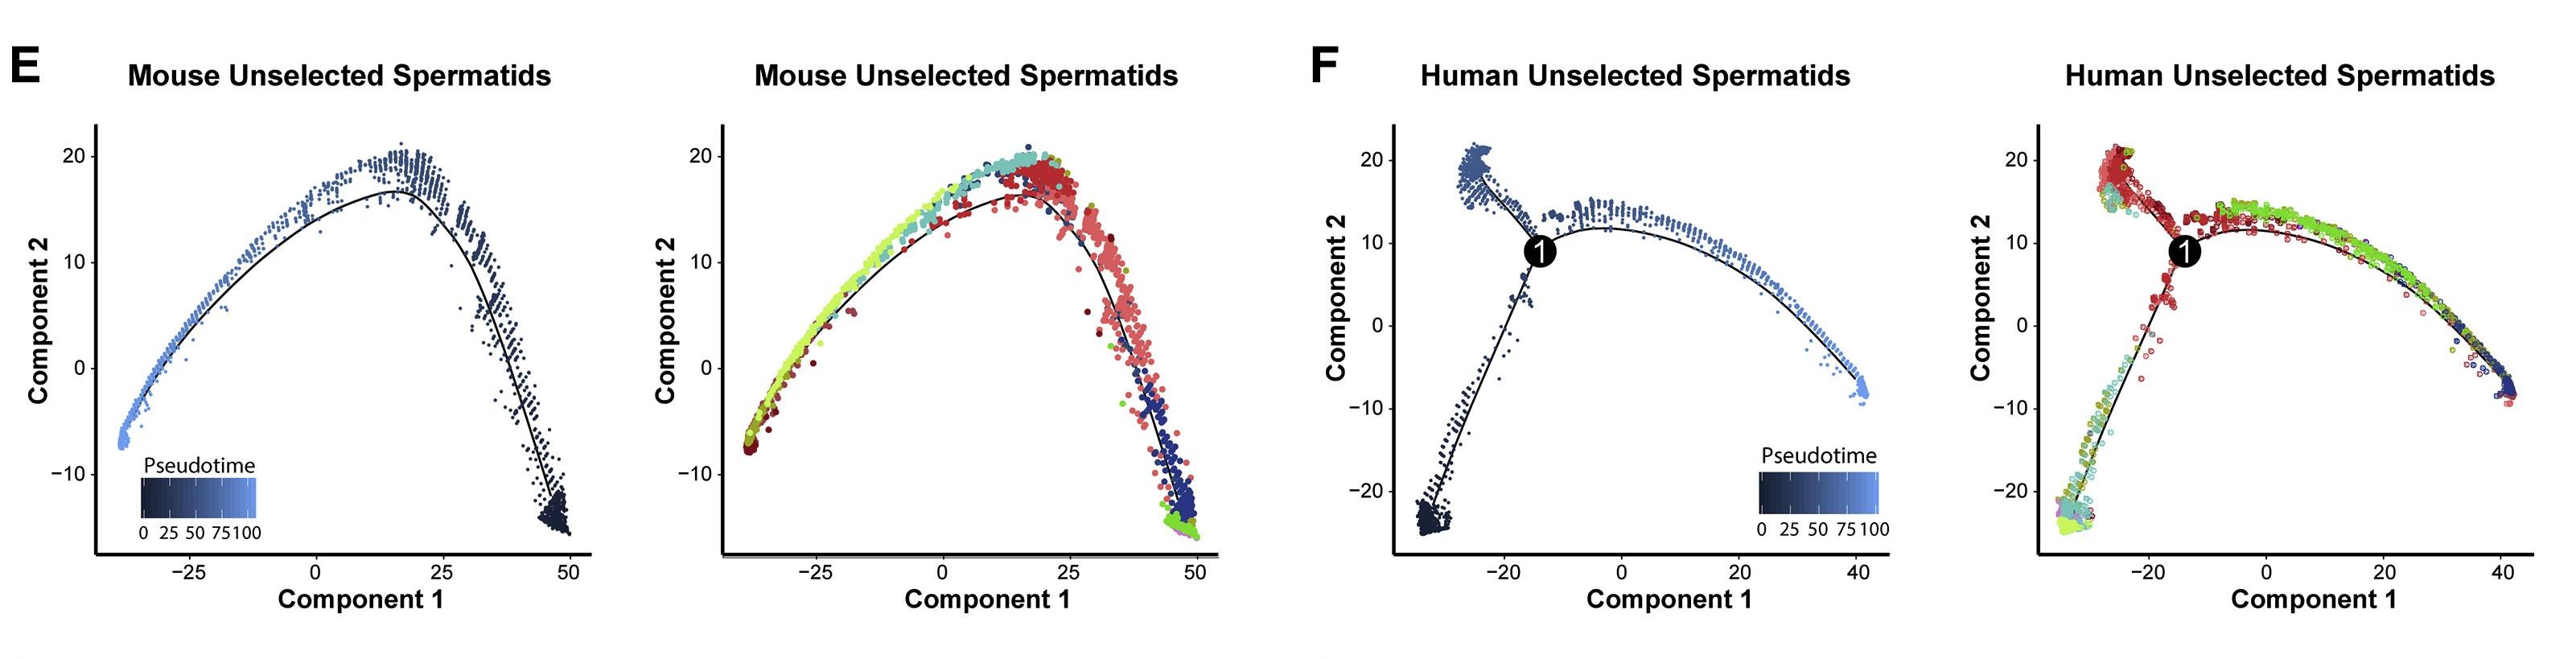
Figure 5, E and F: Dynamic Transcriptome Changes during Spermiogenesis Precede Production of Functional Spermatozoa
Single-cell transcriptomes from (E) mouse unselected spermatids and (F) human unselected spermatocytes were subsequently used for unbiased dynamic lineage analysis producing cell trajectories with spermatids ordered in pseudotime (left) and colored according to tSNE cell cluster (right).
Licensed under: https://creativecommons.org/licenses/by-nc-nd/4.0/
Results
- Table S4: Human and Mouse SSC comparison first
- Table S4: Human and Mouse Spermatid comparison first
- Table S2, related to Figure 3: Ad Mouse unselected SPG Pseudotime first
- Table S2, related to Figure 3: Human unselected SPG Pseudotime first
- Table S4: KEGG Up in Human SSC first
- Table S4: KEGG Up in Mouse SSC first
- Table S4: KEGG Up in Mouse SCT first
- Table S4: KEGG Up in Human STD first
- Table S4: KEGG Up in Mouse STD first
- Table S4: KEGG Up in Human SCT first
- Table S3, related to Figure 3: Ad Mouse Unselected SPG Pseudotime first
- Table S3, related to Figure 3: Human unselected SPG Pseudotime first
Data set 5: Spermatogonial Gene Expression Programs in the Immature Mouse Testis Are Distinct from Those in the Adult Mouse Testis
Transcriptome: Other
Species
| Species |
|---|
| Mouse |
Tissue Types
| BRENDA tissue ontology | Maturity | Description | Species | Replicates |
|---|---|---|---|---|
| BTO_0001363: testis | Neonatal | Mouse | ||
| BTO_0001363: testis | Adult | Mouse |
Cell Types
| Cell ontology | Maturity | Description | Species | Replicates | Cells per replicate |
|---|---|---|---|---|---|
| CL_0000020: spermatogonium | Neonatal | p6 (6 day postpartum) | Mouse | ||
| CL_0000020: spermatogonium | Adult | Mouse |
Images
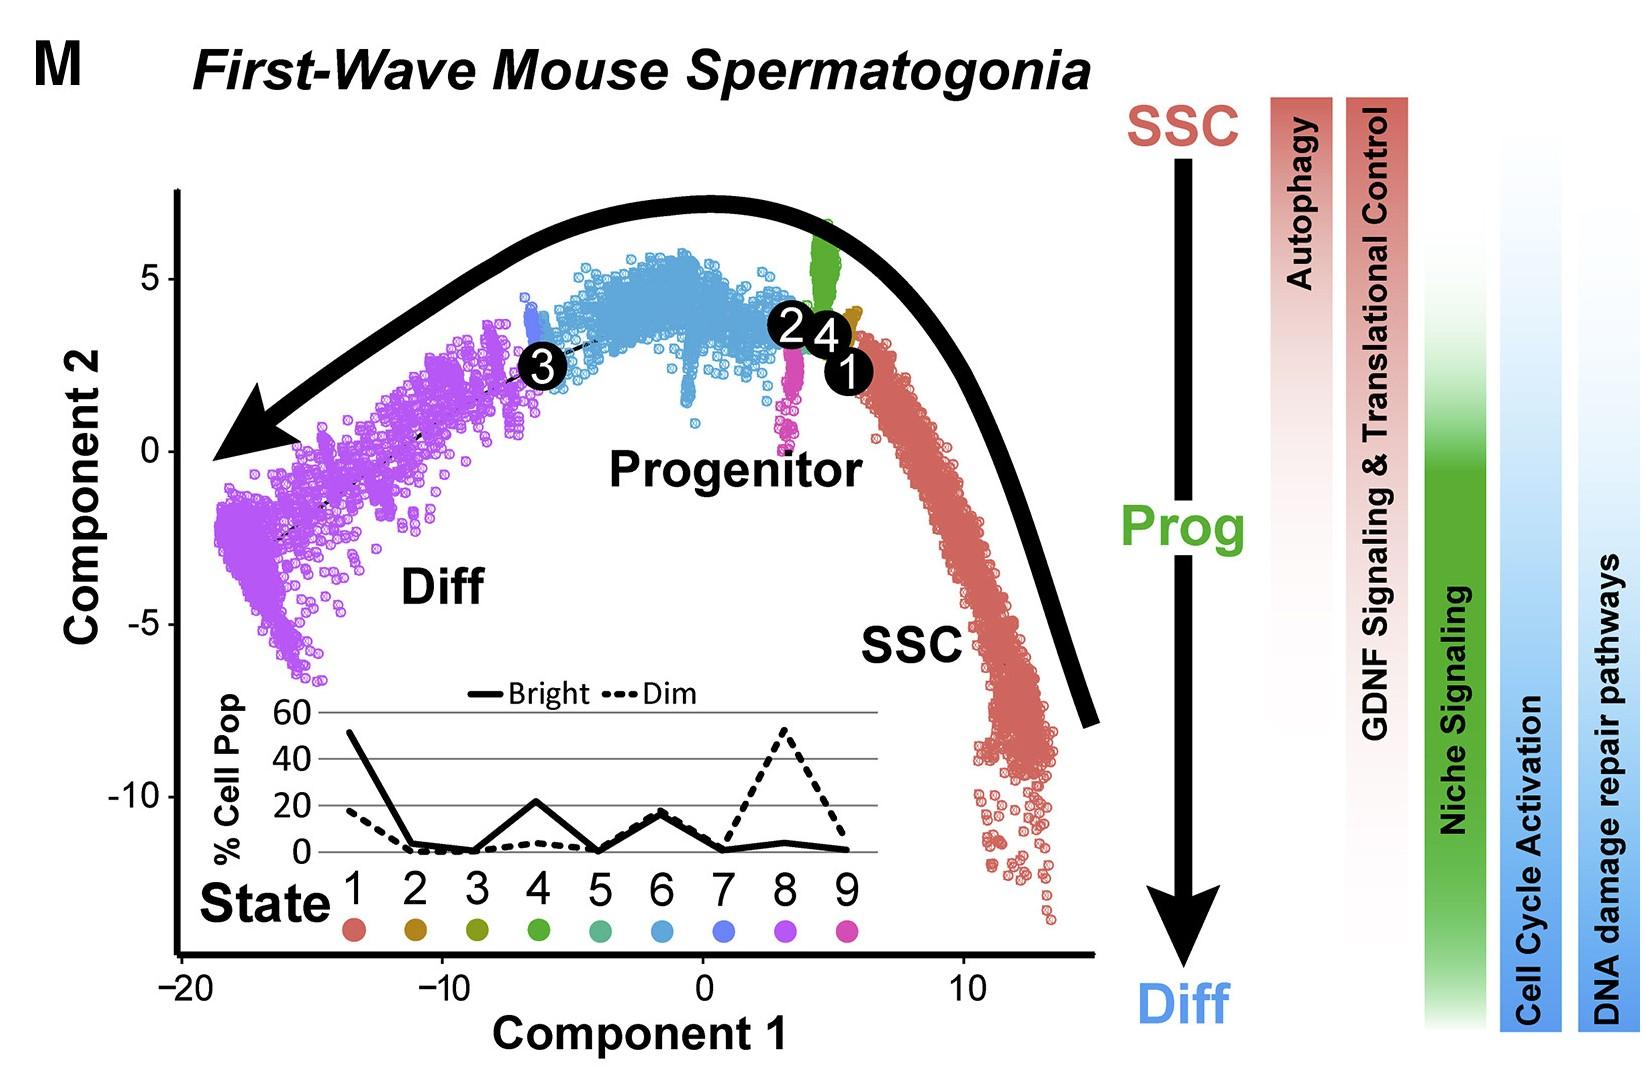
Figure 6 M: Neonatal Mouse Spermatogonia Exhibit Unique Developmental Characteristics during the First Wave of Spermatogenesis
The P6 spermatogonial trajectory (identical to Figure 6F) is colored by cell state and illustrates biologically significant differences across pseudotime and significant pathways are summarized to the right. Inset graph shows the distribution (percentage of the sorted ID4-EGFPbright spermatogonia and ID4-EGFPdim spermatogonia) as shown in (G) and (H), among the noted nine spermatogonial states.
Licensed under: https://creativecommons.org/licenses/by-nc-nd/4.0/